
Last analysis expected expected price to continue to move higher during Tuesday’s session which is what we have seen.
Today I have just one hourly wave count for you. The other two were not invalidated, but they look wrong. I will continue with the wave count that has the best fit and look.
Click on the charts below to enlarge.
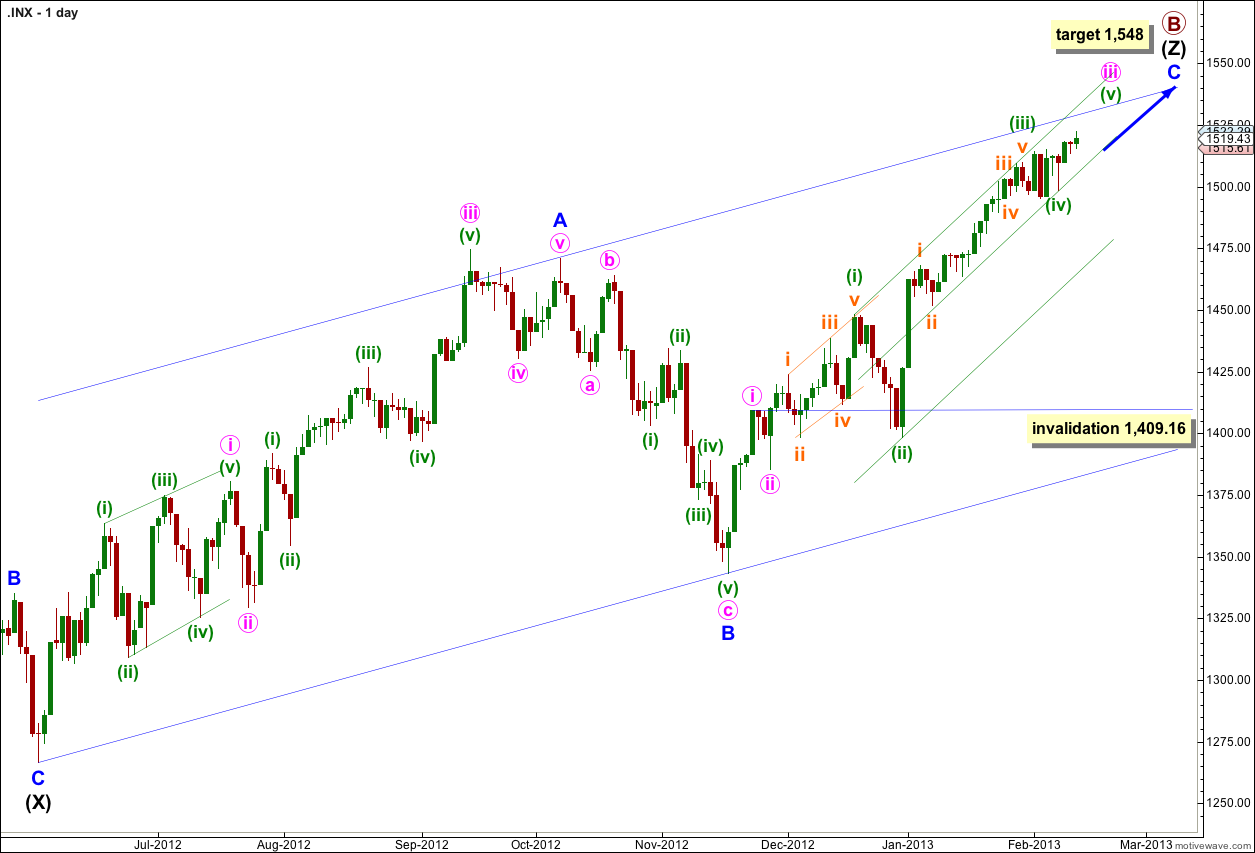
The structure for primary wave B is a triple zigzag. Because three is the maximum number of structures within a multiple when this third zigzag is finally complete then the entire correction for primary wave B must be complete. There is no other Elliott wave structure which could allow for upwards movement within this wave count at cycle degree.
Wave (Z) black is incomplete as an exaggerated zigzag and wave C blue within it is incomplete.
Within wave iii pink of wave C blue there are some interesting Fibonacci time relationships: wave (i) green lasted 14 days (one more than a Fibonacci 13), wave (ii) green lasted a Fibonacci 8 days, wave (iii) green lasted 20 days (one less than a Fibonacci 21). Wave (iv) green may have been over in 6 days, not close enough for a Fibonacci relationship . So far wave (v) green may have lasted 3 days. In another 2 days it will be a Fibonacci 5 and thereafter a further 3 sessions would take it to a Fibonacci 8. So I would expect this upwards trend to pause in another 2 or 5 sessions.
At 1,548 wave C blue would reach equality with wave A blue. At that point primary wave B would be a 166% correction of primary wave A. This target may be too high. When waves iii and iv pink are complete I will recalculate the target based upon pink wave degree.
I have used Elliott’s channeling technique to draw a channel about wave (Z) black zigzag. Price may find resistance at the upper edge of the channel.
Within wave iii pink wave (iv) green may not move into wave (i) green price territory. This wave count is invalidated with movement below 1,448.
I have drawn a double wide channel about wave iii pink: draw the first trend line from the highs of waves (i) to (iii) green then place a parallel copy upon the low of wave (ii) green. Place a second parallel copy mid way within the channel. Price may remain within the upper half of the channel and may find resistance at the upper trend line.
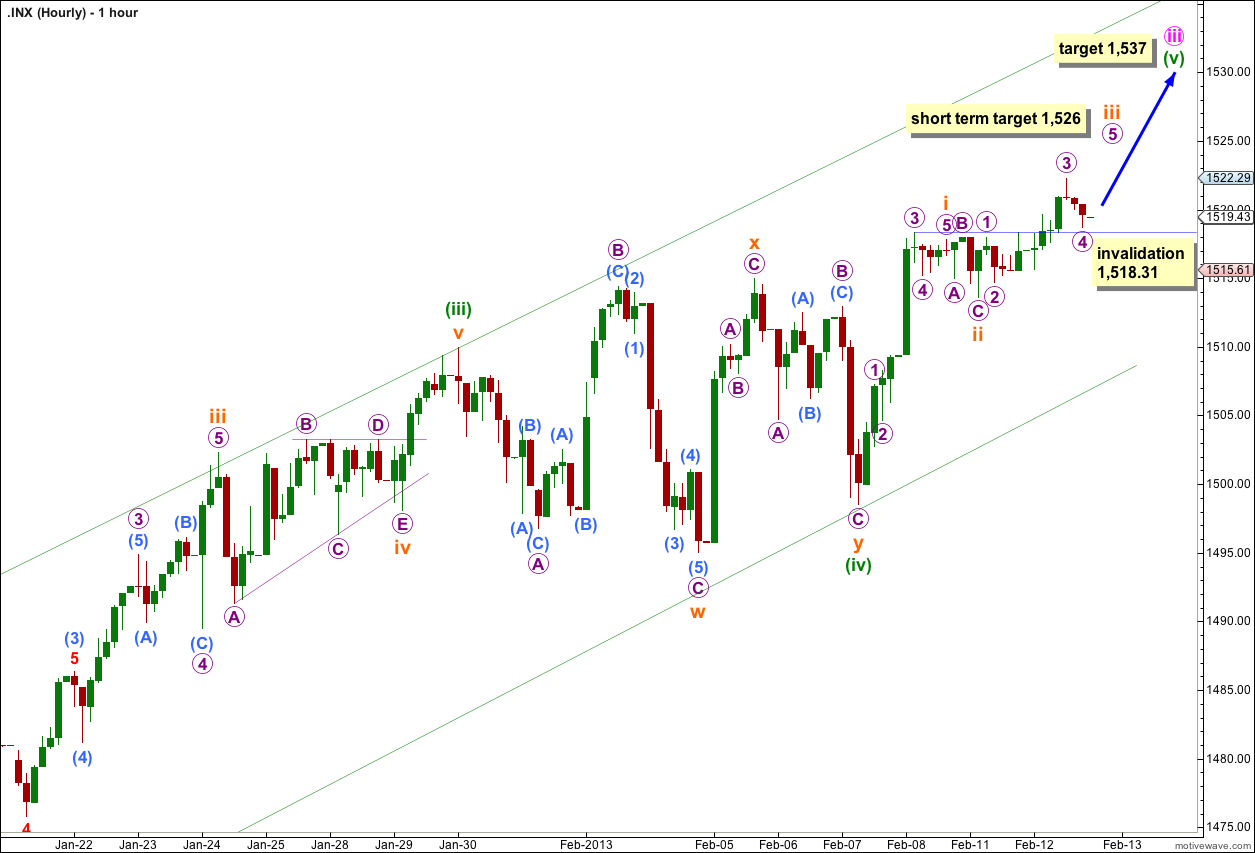
This was yesterday’s alternate wave count. It now has the best look and fit.
Within wave (v) green waves i and ii orange may be complete. Wave iii orange may end next session.
Within wave iii orange wave 3 purple is just 0.57 points longer than 1.618 the length of wave 1 purple.
At 1,526 wave iii orange would reach 0.618 the length of wave i orange, and within wave iii orange wave 5 purple would reach equality with wave 3 purple. This target may be reached in one or two sessions.
Thereafter, wave iv orange may not move into wave i orange price territory. This wave count is invalidated at the hourly level with movement below 1,518.31.
At 1,537 wave (v) green would reach 0.618 the length of wave (i) green.
Price may find resistance at the upper edge of this parallel channel.