
Last analysis expected upwards movement for Friday’s session which is exactly what happened.
The daily chart is the same. The hourly charts also are the same and do not diverge yet, and may not for a few more sessions. This can give us more confidence in the expected direction.
I have a new alternate hourly wave count which does diverge in the expected direction.
Click on the charts below to enlarge.
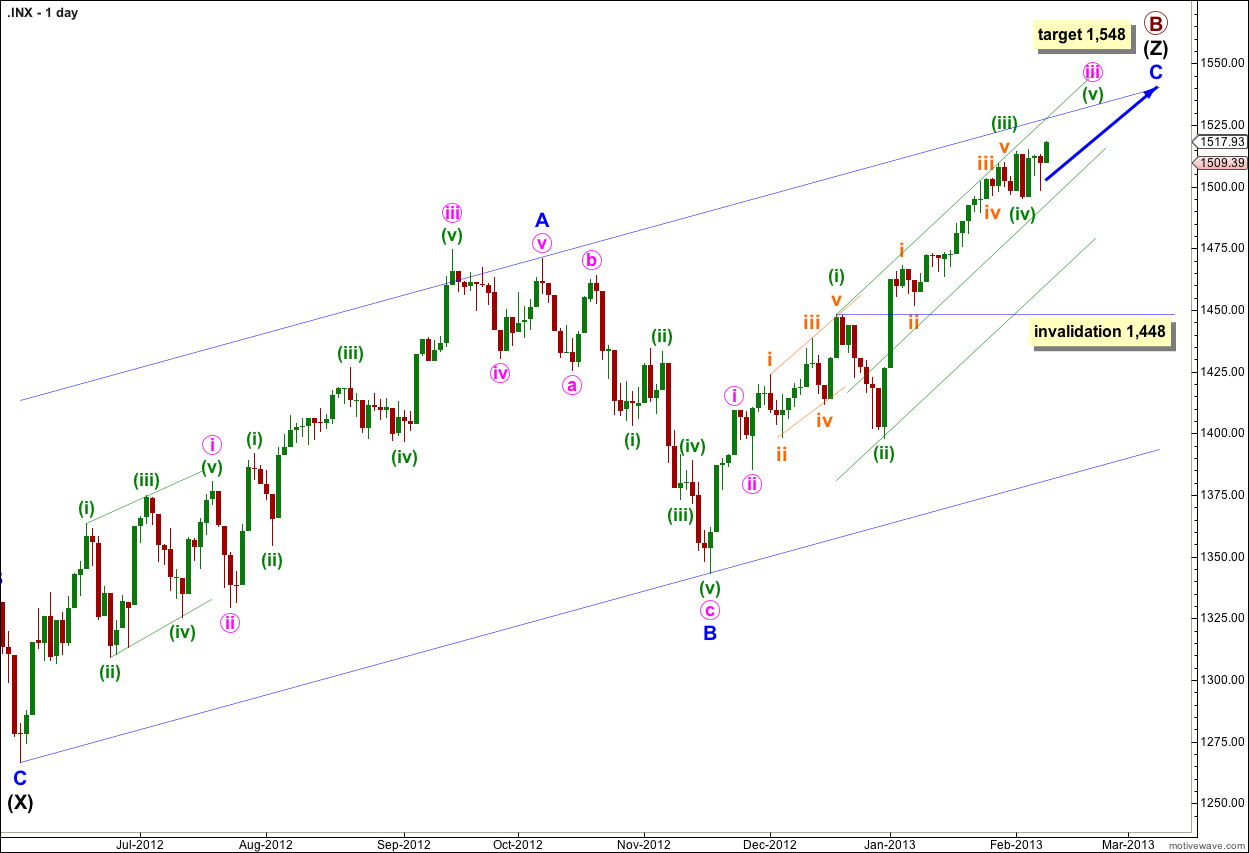
The structure for primary wave B is a triple zigzag. Because three is the maximum number of structures within a multiple when this third zigzag is finally complete then the entire correction for primary wave B must be complete. There is no other Elliott wave structure which could allow for upwards movement within this wave count at cycle degree.
Wave (Z) black is incomplete as an exaggerated zigzag and wave C blue within it is incomplete.
Within wave iii pink of wave C blue there are some interesting Fibonacci time relationships: wave (i) green lasted 14 days (one more than a Fibonacci 13), wave (ii) green lasted a Fibonacci 8 days, wave (iii) green lasted 20 days (one less than a Fibonacci 21), and wave (iv) green may have been over in a Fibonacci 3 days. So far wave (v) green may have lasted 4 days. In another 4 days it will be a Fibonacci 8 and thereafter a further 5 sessions would take it to a Fibonacci 13. So I would expect this upwards trend to pause in another 4 or 9 sessions.
At 1,548 wave C blue would reach equality with wave A blue. At that point primary wave B would be a 166% correction of primary wave A. This target may be too high. When waves iii and iv pink are complete I will recalculate the target based upon pink wave degree.
I have used Elliott’s channeling technique to draw a channel about wave (Z) black zigzag. Price may find resistance at the upper edge of the channel.
Within wave iii pink wave (iv) green may not move into wave (i) green price territory. This wave count is invalidated with movement below 1,448.
I have drawn a double wide channel about wave iii pink: draw the first trend line from the highs of waves (i) to (iii) green then place a parallel copy upon the low of wave (ii) green. Place a second parallel copy mid way within the channel. Price may remain within the upper half of the channel and may find resistance at the upper trend line.
Main Hourly Wave Count.
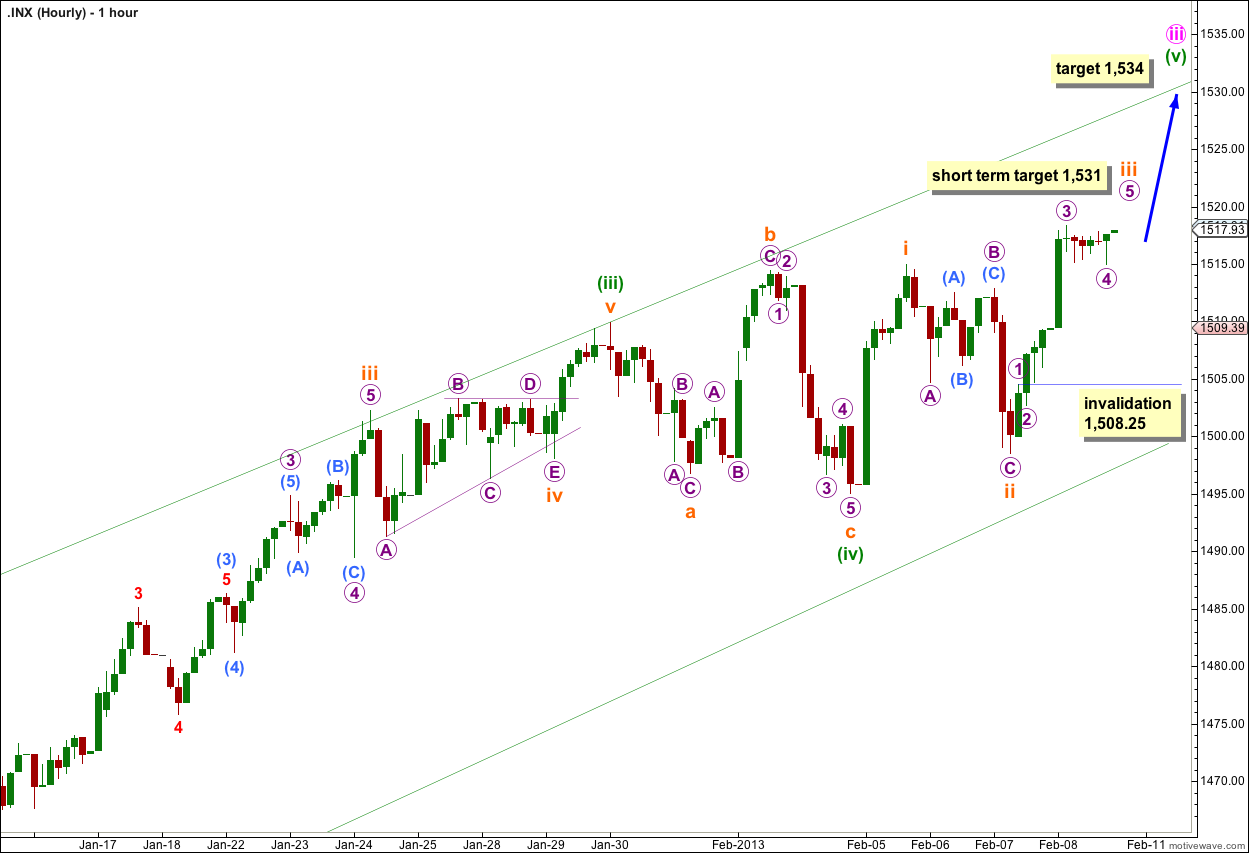
This wave count requires more upwards movement. Wave iii orange must be incomplete. The sideways movement at the end of Friday’s session cannot be wave iv orange because it overlaps into wave i orange price territory by 0.01.
Within wave iii orange waves 1 to 4 purple may be complete. If wave 4 purple continues further sideways (possible but unlikely) then it may not move into wave 1 purple price territory. This wave count is invalidated with movement below 1,508.25. (I have taken this point from an analysis of 5 and 1 minute charts).
At 1,531 wave iii orange would reach 1.618 the length of wave i orange. Also at 1,531 wave 5 purple would reach 1.618 the length of wave 1 purple. This target has a reasonable probability. It may be reached in the next one or possibly two sessions.
At 1,534 wave (v) green would reach 0.618 the length of wave (i) green.
Keep drawing the green parallel channel on the daily chart and copy it over to the hourly chart. Draw the first trend line from the highs of waves (i) to (iii) green, then place a parallel copy on the low of (ii) green and another mid way within the channel. The upper edge may provide resistance and may be where wave (v) green ends.
Alternate Hourly Wave Count.
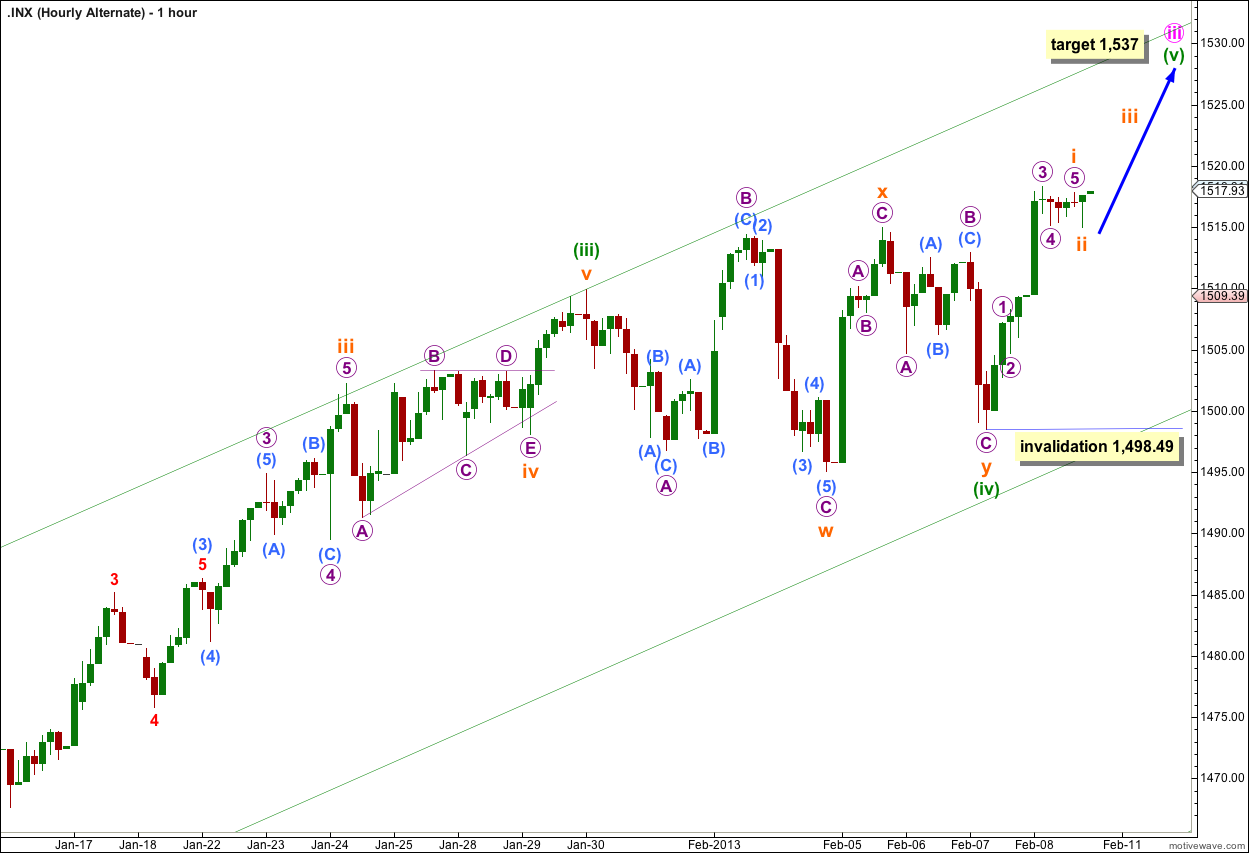
It is also possible that only wave i orange within wave (v) green is complete.
This alternate also expects upwards movement for the next session. If upwards movement increases in momentum this may be a likely explanation.
At 1,537 wave (v) green would reach 0.618 the length of wave (i) green.
Within wave (v) green wave ii orange may move beyond the start of wave i orange. This wave count is invalidated with movement below 1,498.49.
Second Alternate Hourly Wave Count.
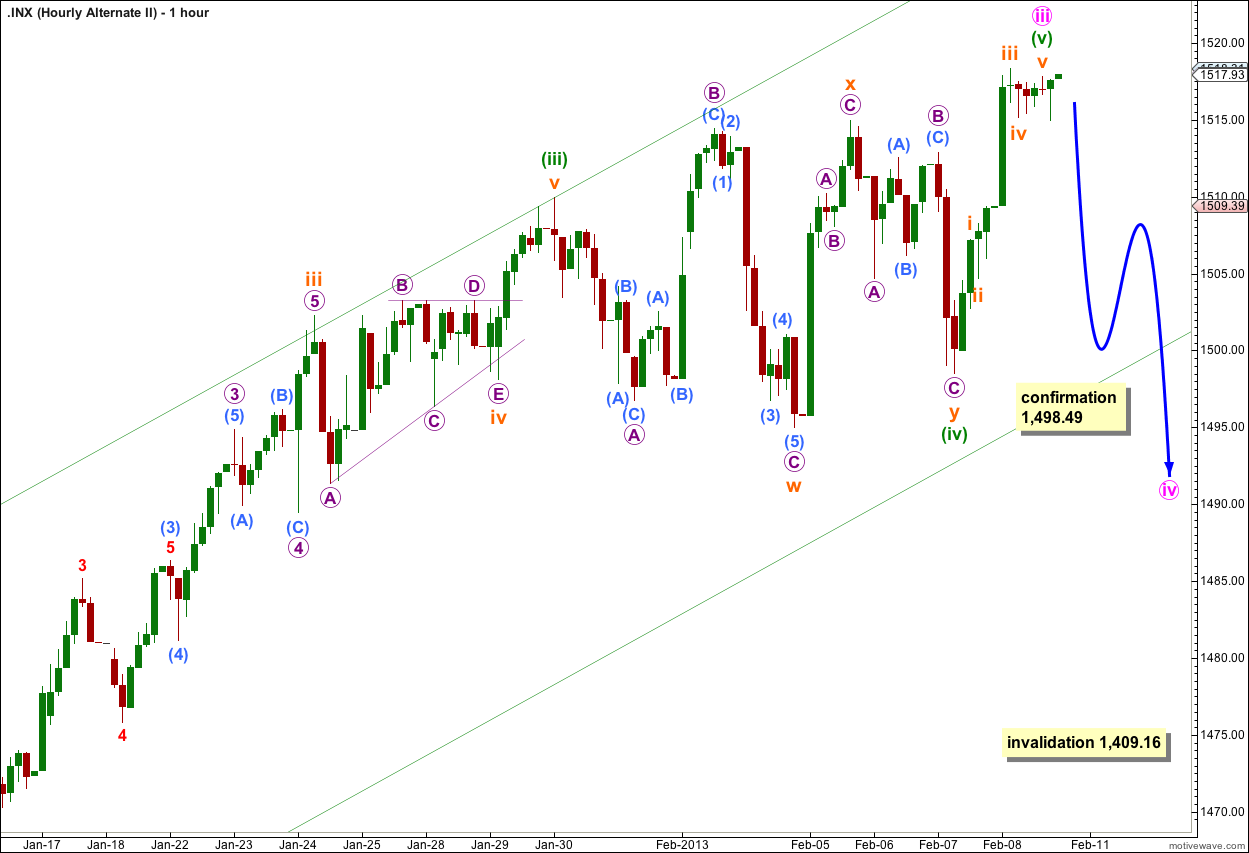
If we simply move the degree of labeling within wave (v) green up one degree we see that wave iii pink in its entirety may now be over.
This would see a remarkably brief wave (v) green though, and waves (iv) and (v) green would have no Fibonacci time relationship.
Within wave iii pink wave (iii) green is 10.59 points longer than 1.618 the length of wave (i) green (this is just less than a 10% variation and so acceptable), and there is no Fibonacci ratio between wave (v) green and either of waves (i) or (iii).
This alternate has the lowest probability, because of the brevity of wave (v) green. We may use it if it is confirmed with movement below 1,498.49. At that stage we may expect choppy overlapping sideways movement for about a week or so.
Wave iv pink may not move into wave i pink price territory. This wave count is invalidated with movement below 1,409.16.
Yes, i get a message saying Internet Explorer cannot open the web site
Try clearing your cache then try again.
If that doesn’t work try another browser.
I’m using safari and that’ working fine.
Hi Lara, I can’t open Predictions. Can you help?
regards,
Gary
Hi Gary,
Do you mean the website http://www.elliottwavepredictions.com ? I tested the link and it’s working fine from my site here…
Or do you mean something else?