
Analysis of Monday’s session expected more upwards movement from the S&P 500 for Tuesday’s session, which is what we have seen. Price is moving closer to the target on the hourly chart.
The daily wave count and hourly wave counts remain mostly the same. The target has been widened to a 2 point target zone.
Click on the charts below to enlarge.
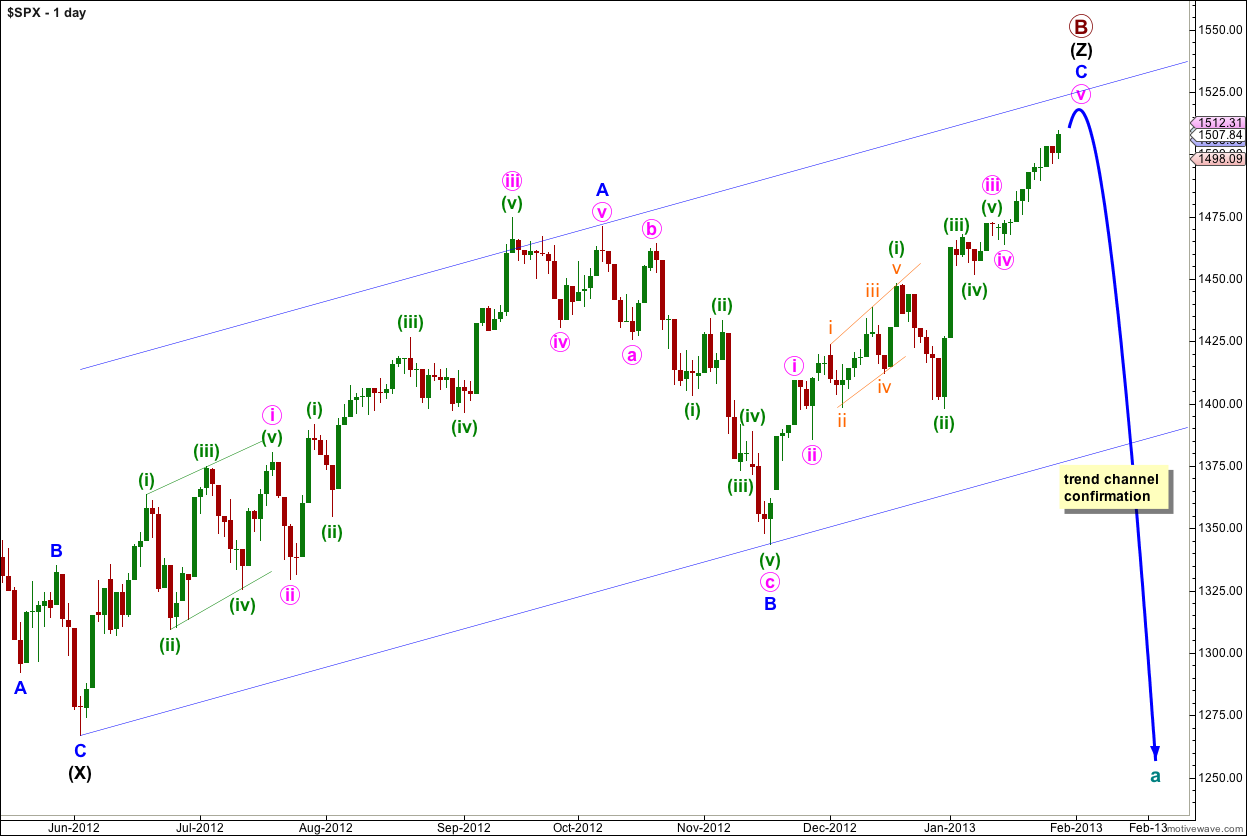
The structure for primary wave B is a triple zigzag, and price is now within the third zigzag in the triple labeled wave (Z) black. Because three is the maximum number of structures within a multiple when this third zigzag is finally complete then the entire correction for primary wave B must be complete. There is no other Elliott wave structure which could allow for upwards movement within this wave count at cycle degree.
Wave (Z) black may now be almost complete as an exaggerated zigzag.
Wave A blue must be truncated to subdivide into a five wave structure.
If primary wave B reaches twice the length of primary wave A at 1,644 although the wave count is not technically invalidated at that point the probability would be so low it should be discarded. At that stage I would switch the monthly wave count to the alternate expanding triangle wave count, which requires a new all time high.
Wave A blue lasted 87 days (2 short of a Fibonacci 89). Wave B blue lasted 28 days. So far wave C blue has lasted 48 days. It may continue for another 7 sessions to last a Fibonacci 55 days.
I have used Elliott’s channeling technique to draw a channel about wave (Z) black zigzag. When this channel is breached by downwards movement we shall have trend channel confirmation of a trend change.
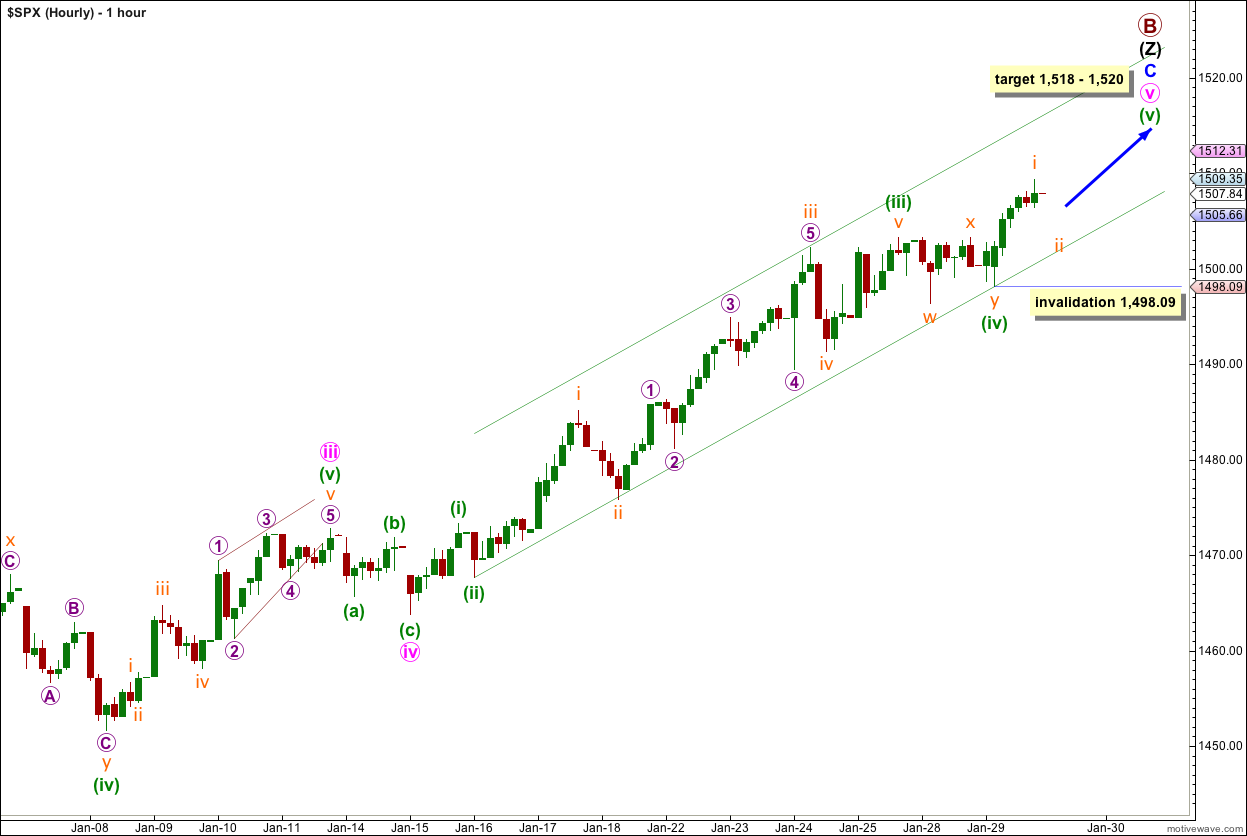
Tuesday’s session began with sideways movement. This was most likely wave (iv) green extending further sideways as a double combination: flat – X – zigzag. The purpose of combinations is to move price sideways and take up time, which is exactly what this one did.
Thereafter, wave (v) green most likely began during Tuesday’s session and took price to a new high. On the five minute chart the upwards movement labeled here wave (v) green could be seen as a complete five wave structure, but that is most likely only wave i orange within wave (v) green.
Wave ii orange may not move beyond the start of wave i orange. This wave count is invalidated with movement below 1,498.09.
At 1,520 wave (v) green would reach 0.618 the length of wave (iii) green. At 1,518 wave v pink would reach 0.618 the length of wave iii pink. The target is now widened slightly to a two point zone.
Draw the channel first with a trend line from the lows of waves (ii) to (iv) green, then place a parallel copy upon the high of wave iii orange within wave (iii) green. Wave (v) green may stay along the mid line of this channel, or it may find resistance about the upper edge.