
Last analysis expected upwards movement from the S&P 500. Price has moved lower within an allowable range, remaining above the invalidation point, but at this stage the wave count as I had it on the hourly chart does not now have the right look.
I have adjusted analysis of most recent movement and I have a new hourly wave count today which has a much better look. The mid term target remains the same, but this new wave count explains recent movement more satisfactorily.
Click on the charts below to enlarge.
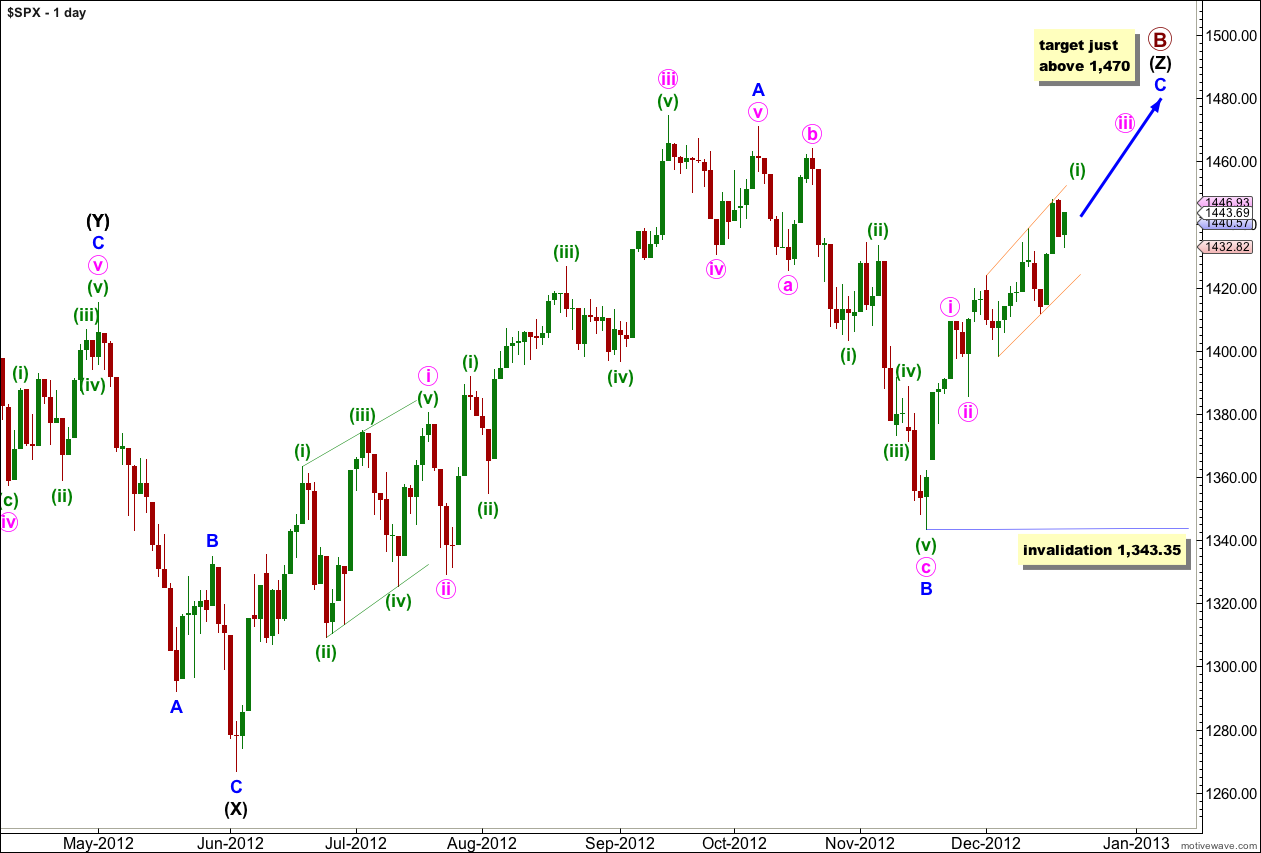
The structure for primary wave B is a triple zigzag, and price is now within the third zigzag in the triple labeled wave (Z) black.
Wave (Z) black is incomplete and is unfolding as an exaggerated zigzag.
Wave A blue must be truncated to subdivide into a five wave structure.
At 1,470 wave C blue would reach 0.618 the length of wave A blue. About this point primary wave B would also be only 139% of primary wave A. Movement to slightly above 1,470 would avoid a truncation and keep the length of primary wave B closer to the common maximum of 138%.
There is no upper invalidation point for this wave count, but significant movement above 1,470 has a low probability.
Wave A blue lasted 87 days (2 short of a Fibonacci 89). Wave B blue lasted 28 days. I would expect wave C blue to be about 34 days in duration. So far it has only lasted 22 days and it should continue for another couple of weeks or so.
Wave C blue must subdivide into a five wave structure as either an ending diagonal or an impulse. An ending diagonal requires all subwaves to subdivide as zigzags and because the first wave upwards labeled i pink is a five wave impulse an ending diagonal may be eliminated. Wave C blue must be unfolding as an impulse. The structure is incomplete and requires further upwards movement.
Recent upwards movement from the low labeled wave B blue at 1,343.35 looks like a smaller fractal of the upwards movement from the low labeled wave (X) black.
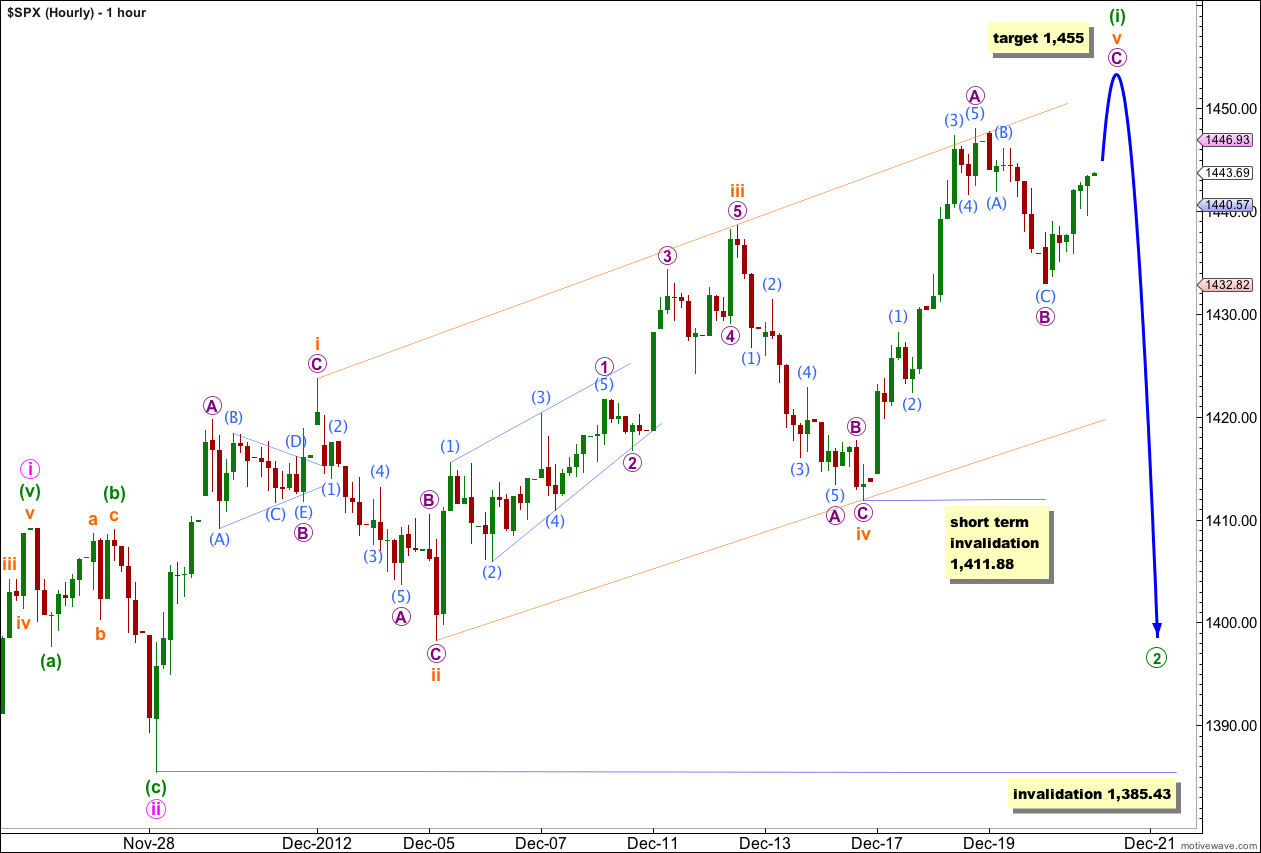
With the overlapping in recent upwards movement it looks likely that a leading expanding diagonal may be unfolding in a first wave position. The diagonal would be incomplete.
Wave i orange subdivides nicely into a zigzag where wave C purple is 1.13 points short of 0.382 the length of wave A purple.
Wave ii orange is a 67% correction of wave i orange. Wave C purple within wave ii orange is just 0.13 points short of 0.618 the length of wave A purple.
Wave iii orange subdivides best into an impulse. Wave 3 purple has no Fibonacci ratio to wave 1 purple, and wave 5 purple is 0.52 points longer than 0.382 the length of wave 1 purple.
Wave iv orange is a 66% correction of wave iii orange.
Wave v orange is most likely an incomplete zigzag. Wave A purple subdivides into a five wave impulse. Wave B purple is an incomplete zigzag, wave (C) aqua within it is incomplete on the five minute chart. We should expect a little more downwards movement to begin tomorrow’s session.
Wave B purple may not move beyond the start of wave A purple.
When wave B purple is complete wave C purple should take price above the end of wave A purple at 1,448 to avoid a truncation.
The diagonal is expanding so wave v orange should be longer than wave iii orange. Wave v orange would reach equality with wave iii orange at 1,452 and it should move above this point.
Wave v orange may find some resistance about the upper trend line drawn from the highs of waves i to iii orange.
When wave v orange is complete then the diagonal for wave (i) green will be complete.
Following a leading diagonal in a first wave position the second wave is most likely to be very deep. We should expect wave (ii) green to be over 0.618 the length of wave (i) green. Wave (ii) green may not move beyond the start of wave (i) green. This wave count is invalidated with movement below 1,385.43.
Lara, could you please one day soon do a session on labelling charts in Motivewave. I think it would be really useful and also go into how you save different time level charts.
hey, that’s a really good idea!
I’ll have a think about how that would work, and it would have to be in the new year now with Christmas almost upon us.
Lara, a picky point but your green 2 on the hourly is a circle arab number and not a bracket Roman?
that’s a motive wave issue
in “markers” there are numbers and letters, but no (ii)