
Last analysis of the S&P 500 expected upwards movement with increased momentum which is exactly what has happened during Tuesday’s session.
The wave count remains the same.
Click on the charts below to enlarge.
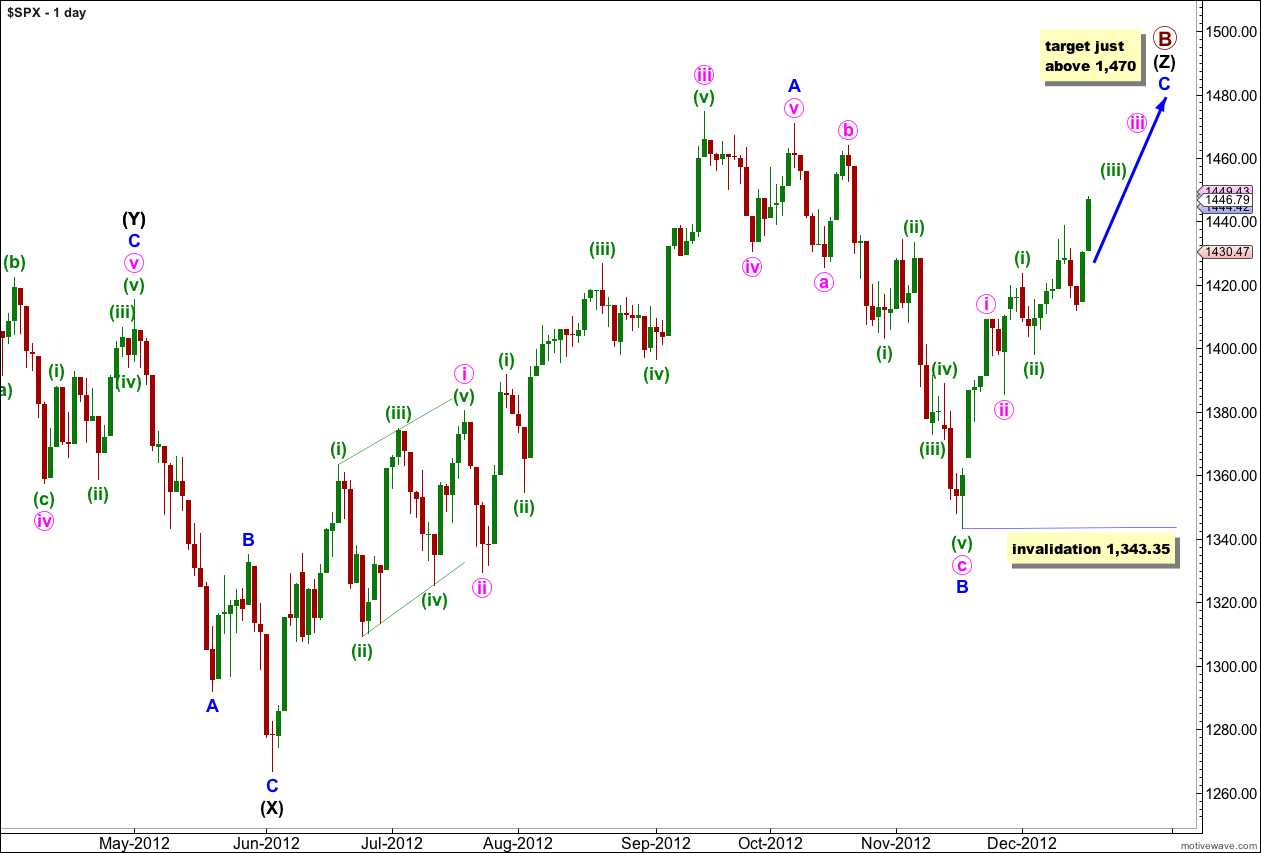
The structure for primary wave B is a triple zigzag, and price is now within the third zigzag in the triple labeled wave (Z) black.
Wave (Z) black is incomplete and is unfolding as an exaggerated zigzag.
Wave A blue must be truncated to subdivide into a five wave structure.
At 1,470 wave C blue would reach 0.618 the length of wave A blue. About this point primary wave B would also be only 139% of primary wave A. Movement to slightly above 1,470 would avoid a truncation and keep the length of primary wave B closer to the common maximum of 138%.
There is no upper invalidation point for this wave count, but significant movement above 1,470 has a low probability.
Wave A blue lasted 87 days (2 short of a Fibonacci 89). Wave B blue lasted 28 days. I would expect wave C blue to be about 34 days in duration. So far it has only lasted 21 days and it should continue for another couple of weeks or so.
Wave C blue must subdivide into a five wave structure as either an ending diagonal or an impulse. An ending diagonal requires all subwaves to subdivide as zigzags and because the first wave upwards labeled i pink is a five wave impulse an ending diagonal may be eliminated. Wave C blue must be unfolding as an impulse. The structure is incomplete and requires further upwards movement.
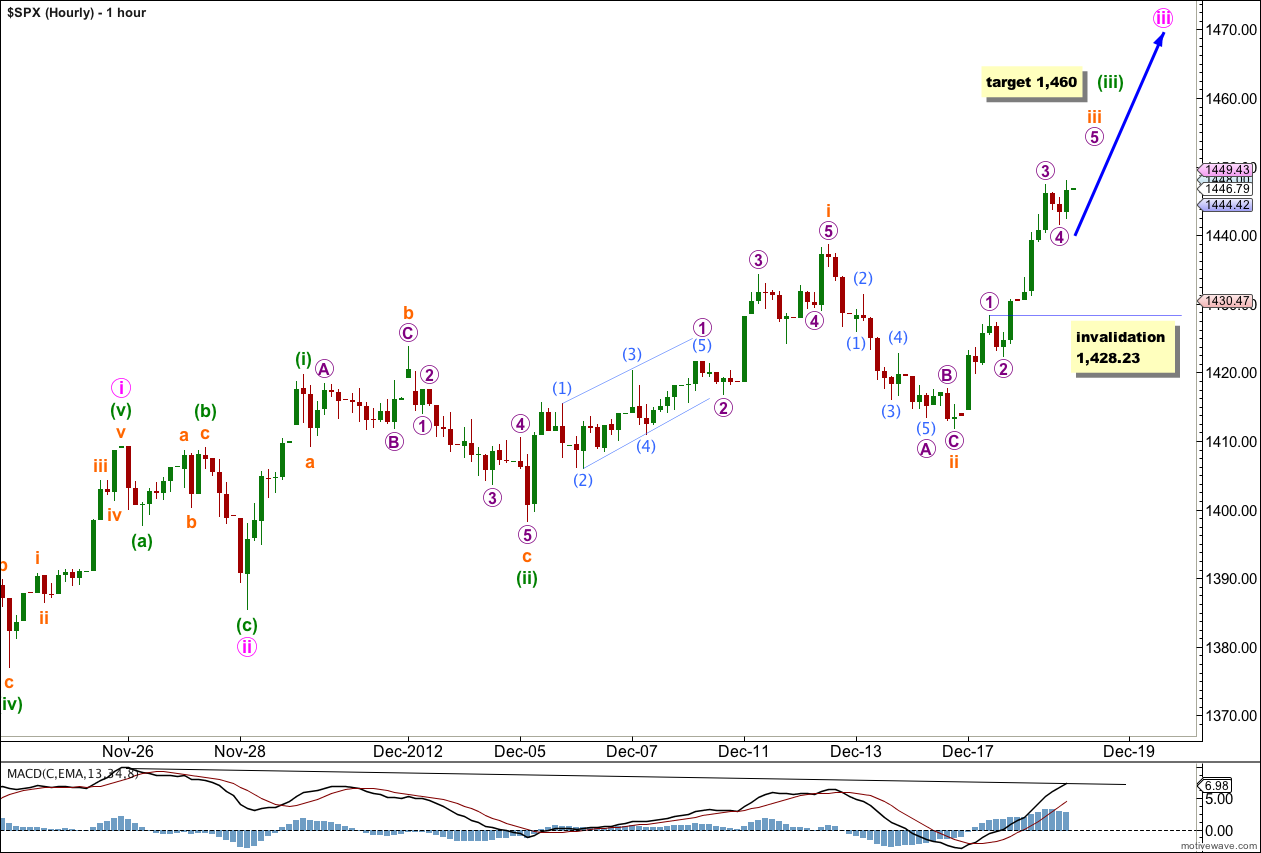
MACD indicates an increase in momentum for Tuesday’s upwards movement. Momentum must increase further to exceed the momentum high at the end of wave i pink.
Within wave iii orange wave 3 purple is 1.48 points short of 1.618 the length of wave 1 purple. I would not expect to see a Fibonacci ratio between wave 5 purple and either of waves 1 or 3 purple. However, wave 5 purple would reach equality with wave 1 purple at 1,458. This target does not have a high probability.
At 1,460 wave (iii) green would reach 1.618 the length of wave (i) green. This target is probably still over a week away.
When wave iii orange is complete we may use Elliott’s technique to draw a parallel channel about this impulse. We may be able to do that after tomorrow’s session.
Within wave iii orange wave 4 purple may not move into wave 1 purple price territory. This wave count is invalidated in the short term with movement below 1,428.23.
When the next upwards movement of wave 5 purple completes wave iii orange then the invalidation point must move up to the high of wave i orange at 1,438.59. Wave iv orange may not move into the price territory of wave i orange.
Thank you for your Christmas Card. Happy Christmas to you and wishing a good year ahead.
In today’s video you mention the usual length for wave 2 and 4 corrections in diagonals is 66% to 81%. Could you cite the reference please and also any decent literaure apart from Frost/Prechter on EW diagonals. Thanks!
“Elliott Wave Principle” by Frost and Prechter, 10th edition, page 87.
After years of getting bogged down in rubbish online I’ve come to the conclusion that one should stick with the experts, Frost and Prechter. So no, I cannot give you any other references. I use only Frost and Prechter.