
Last analysis expected upwards movement but price moved lower. Price remains above the invalidation point on the hourly chart and the wave count remains the same.
The structure for both the S&P 500 and the DJIA is incomplete.
Click on the charts below to enlarge.
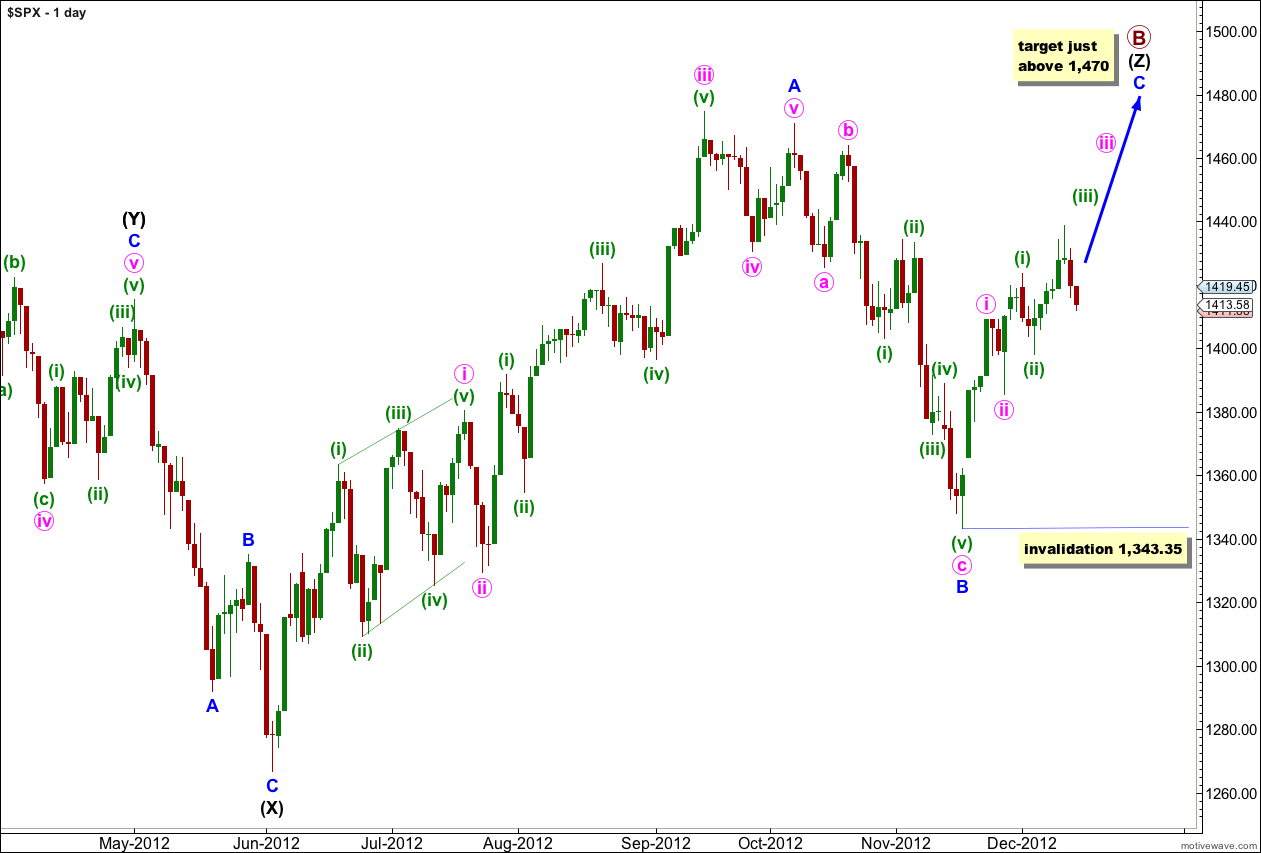
The structure for primary wave B is the same and this wave count is the same at the monthly chart level up to the start of wave (Z) black, the third zigzag in the triple.
Wave (Z) black may be incomplete and may be unfolding as a more exaggerated zigzag.
Wave A blue must be truncated to subdivide into a five wave structure.
At 1,470 wave C blue would reach 0.618 the length of wave A blue. About this point primary wave B would also be only 139% of primary wave A. Movement to slightly above 1,470 would avoid a truncation and keep the length of primary wave B closer to the common maximum.
There is no upper invalidation point for this wave count, but significant movement above 1,470 has a low probability.
Wave A blue lasted 87 days (2 short of a Fibonacci 89). Wave B blue lasted 28 days. I would expect wave C blue to be about 34 days in duration. So far it has only lasted 19 days and it should continue for another couple of weeks or so.
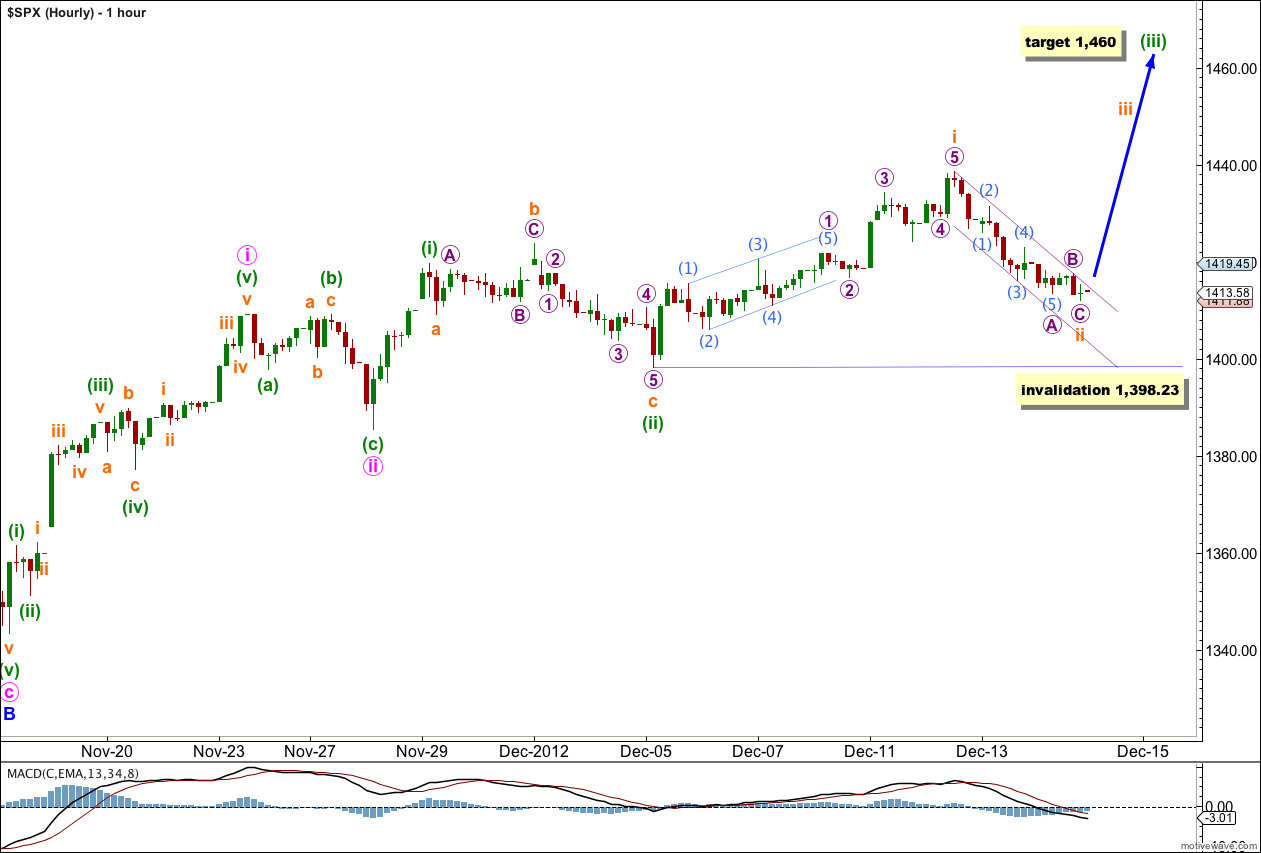
Wave ii orange moved a little lower during Friday’s session. Wave C purple within wave ii orange is just 0.12 points longer than 0.236 the length of wave A purple.
The structure for wave C blue is still incomplete. The middle of the third wave is yet to unfold.
The strong upwards momentum we expected at the end of last week should unfold next week.
At 1,460 wave (iii) green would reach 1.618 the length of wave (i) green.
Within wave (iii) green wave ii orange may not move beyond the start of wave i orange. This wave count is invalidated with movement below 1,398.23.
If price moves below 1,398.23 then it may be wave ii pink within wave C blue unfolding as an expanded flat correction. Although this would have an odd look to it, it is technically possible. That is why the invalidation point on the daily chart is at the start of wave i pink.
Hi Lara,
don’t worry I’ve just answered my last question by playing your video back. On the Day chart it is five waves up so far, so must be wave A of the correction.