
Yesterday’s analysis expected upwards movement from the S&P 500 for Thursday’s session which is what has happened.
I have the same daily wave count for you, with the same two hourly wave counts. Today the main hourly wave count has increased in probability while the alternate has decreased.
Click on the charts below to enlarge.
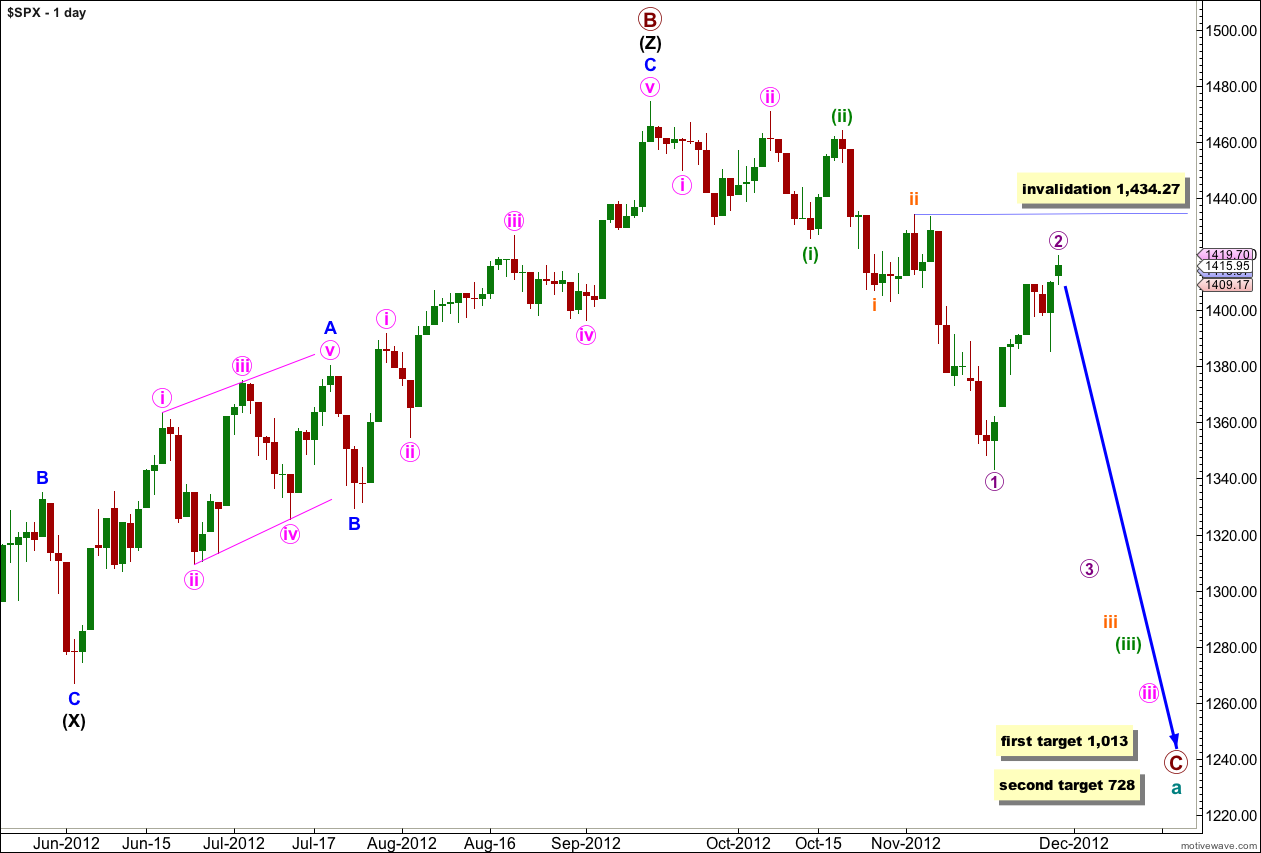
We have recently seen a major trend change in the S&P 500 and the DJIA. This wave count sees the trend at primary degree, so targets are long term and they are months away.
Within the new downwards trend we may be seeing a series of first and second overlapping waves complete. The most commonly extended wave within an impulse is the third wave, and within wave iii pink we should expect wave (iii) green to likely be extended. This necessarily begins with a series of overlapping first and second waves, and this wave count has a very typical look.
Cycle wave a is an expanded flat correction: primary wave A was a three wave structure, and primary wave B was a triple zigzag and 140% the length of primary wave A.
At 1,013 primary wave C would reach 1.618 the length of primary wave A. If price continues downwards through this first target then the next target is at 728 where primary wave C would reach 2.618 the length of primary wave A.
I have tried to see various combinations of a leading diagonal in the first waves after the high of 1,474.51 labeled primary wave B. I cannot find a scenario which fits expected wave lengths for a diagonal, and it would be neither expanding nor contracting. This scenario charted has a much higher probability.
Main Hourly Wave Count.
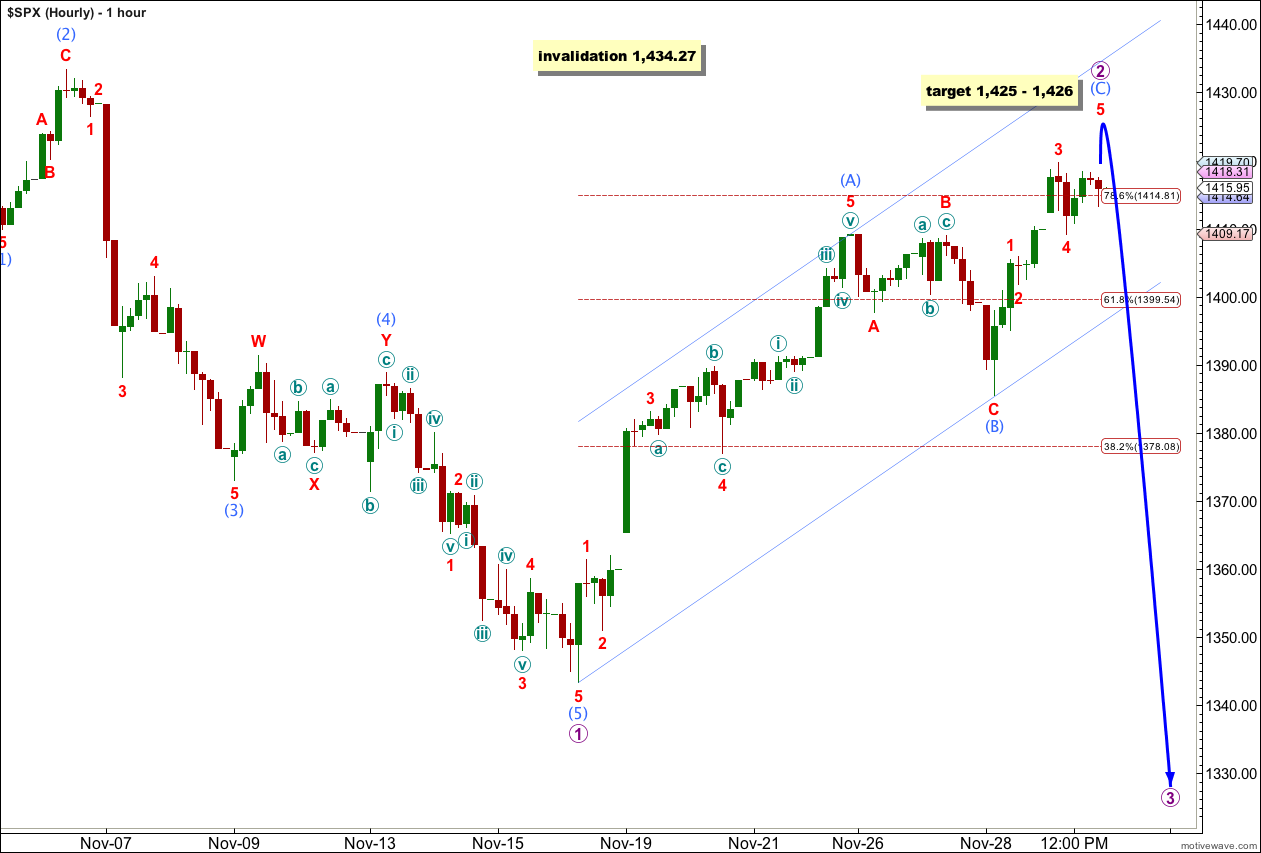
Wave (C) aqua has moved higher as expected for this wave count. Wave 2 purple is now over 0.786 the length of wave 1 purple and is a very deep correction. It looks most like a zigzag. This main wave count has a typical look and a higher probability.
Within wave (C) aqua there is a possibility that the fifth wave labeled 5 red may be complete and slightly truncated. If it is then wave 5 red is just 0.37 points short of 0.618 the length of wave 1 red. Wave 3 red is 0.37 points short of 1.618 the length of wave 1 red.
Movement below the start of wave 5 red at 1,409.17 would indicate that wave (C) aqua was complete, and for this wave count that wave 2 purple in its entirety would also be complete.
Alternatively, wave 5 red may be incomplete and may move higher tomorrow. At 1,425 wave 5 red would reach equality in length with wave 1 red. At 1,426 wave (C) aqua would reach 0.618 the length of wave (A) aqua. If price does move higher to start tomorrow then it is fairly likely to reach about this target.
Thereafter, wave 3 purple downwards should begin.
Wave 2 purple may not move beyond the start of wave 1 purple. This wave count is invalidated with movement above 1,434.27.
Alternate Hourly Wave Count.
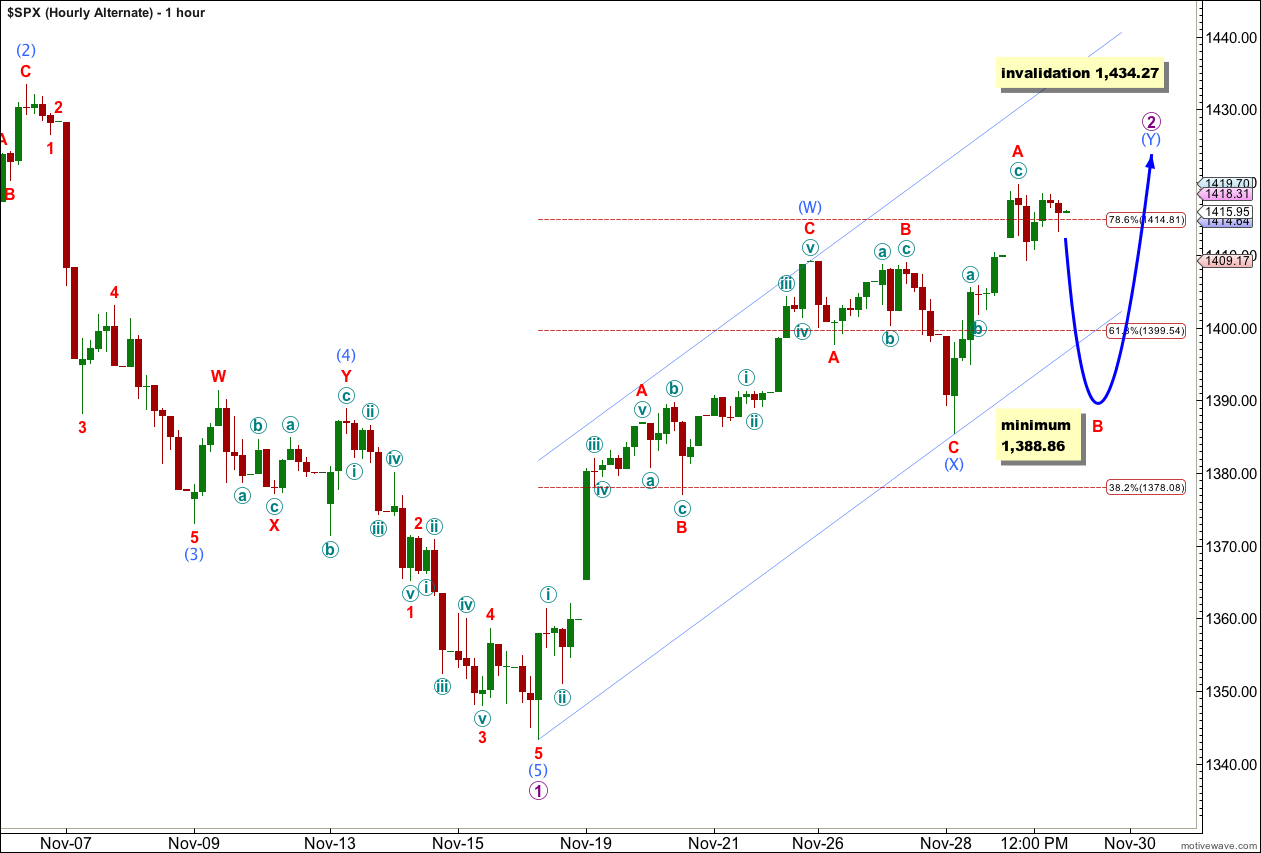
If downwards movement unfolds as a three wave structure then we must consider this possibility. Wave 2 purple may be unfolding as a double combination: zigzag – X wave – flat.
If wave (Y) aqua is a flat correction then wave A red has subdivided into a three, and wave B red must also subdivide into a three. Wave B red must be at least 90% the length of wave A red. This is achieved at 1,388.86.
When price reaches 1,388.86 we must look carefully at the downwards structure. If it is a three then this alternate wave count will have a good probability.
If price moves a little higher tomorrow to make a new high then wave A red will not be a three but a five, and wave (Y) aqua would be a double zigzag. Within a zigzag wave B red may not make a new low below the start of wave A red. Movement below 1,385.43 would invalidate wave (Y) aqua as a zigzag.