
The S&P 500 moved lower within allowable limits during Monday’s session, but upwards movement had been expected.
The wave count remains the same. I have still one daily and one hourly wave count for you today.
Click on the charts below to enlarge.
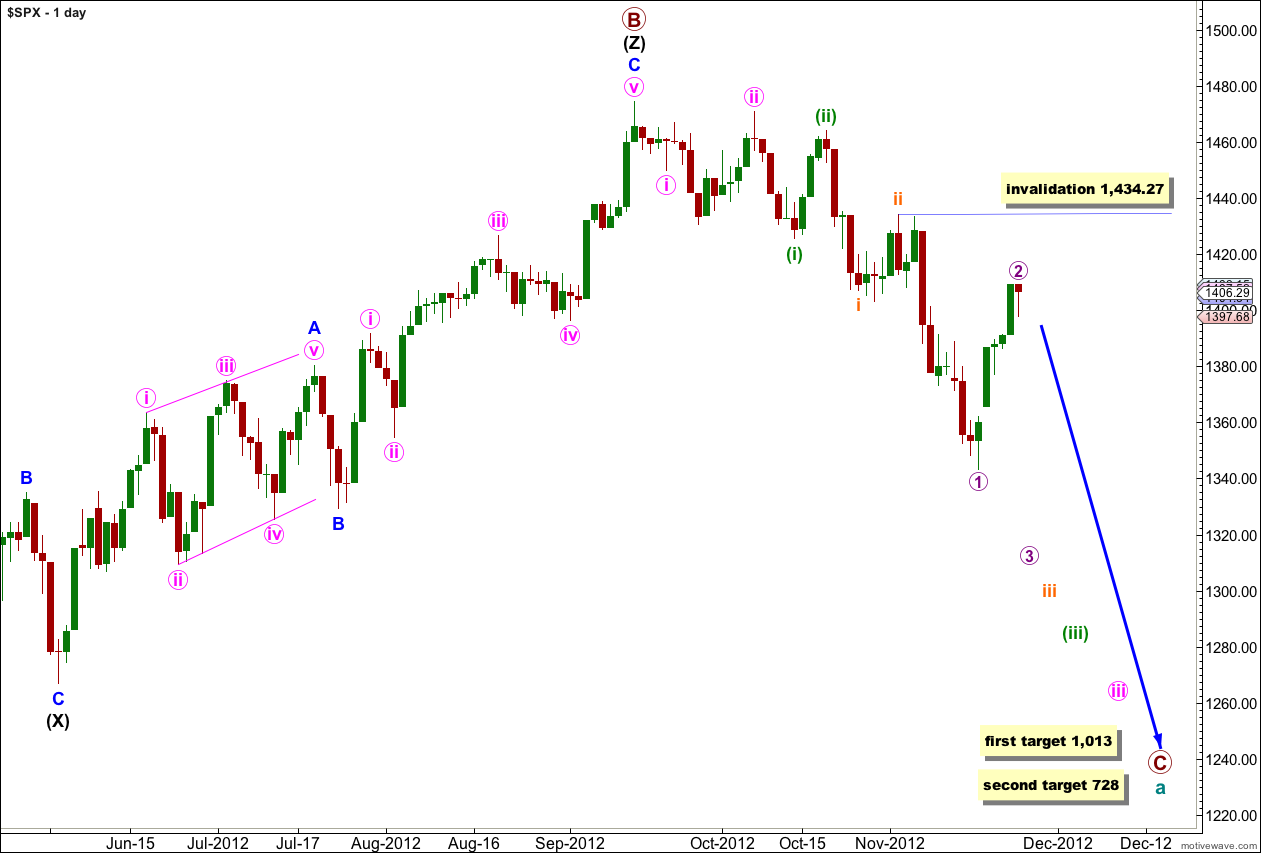
We have recently seen a major trend change in the S&P 500 and the DJIA. This wave count sees the trend at primary degree, so targets are long term and they are months away.
Within the new downwards trend we may be seeing a series of first and second overlapping waves complete. The most commonly extended wave within an impulse is the third wave, and within wave iii pink we should expect wave (iii) green to likely be extended. This necessarily begins with a series of overlapping first and second waves, and this wave count has a very typical look.
Cycle wave a is an expanded flat correction: primary wave A was a three wave structure, and primary wave B was a triple zigzag and 140% the length of primary wave A.
At 1,013 primary wave C would reach 1.618 the length of primary wave A. If price continues downwards through this first target then the next target is at 728 where primary wave C would reach 2.618 the length of primary wave A.
I have tried to see various combinations of a leading diagonal in the first waves after the high of 1,474.51 labeled primary wave B. I cannot find a scenario which fits expected wave lengths for a diagonal, and it would be neither expanding nor contracting. This scenario charted has a much higher probability.
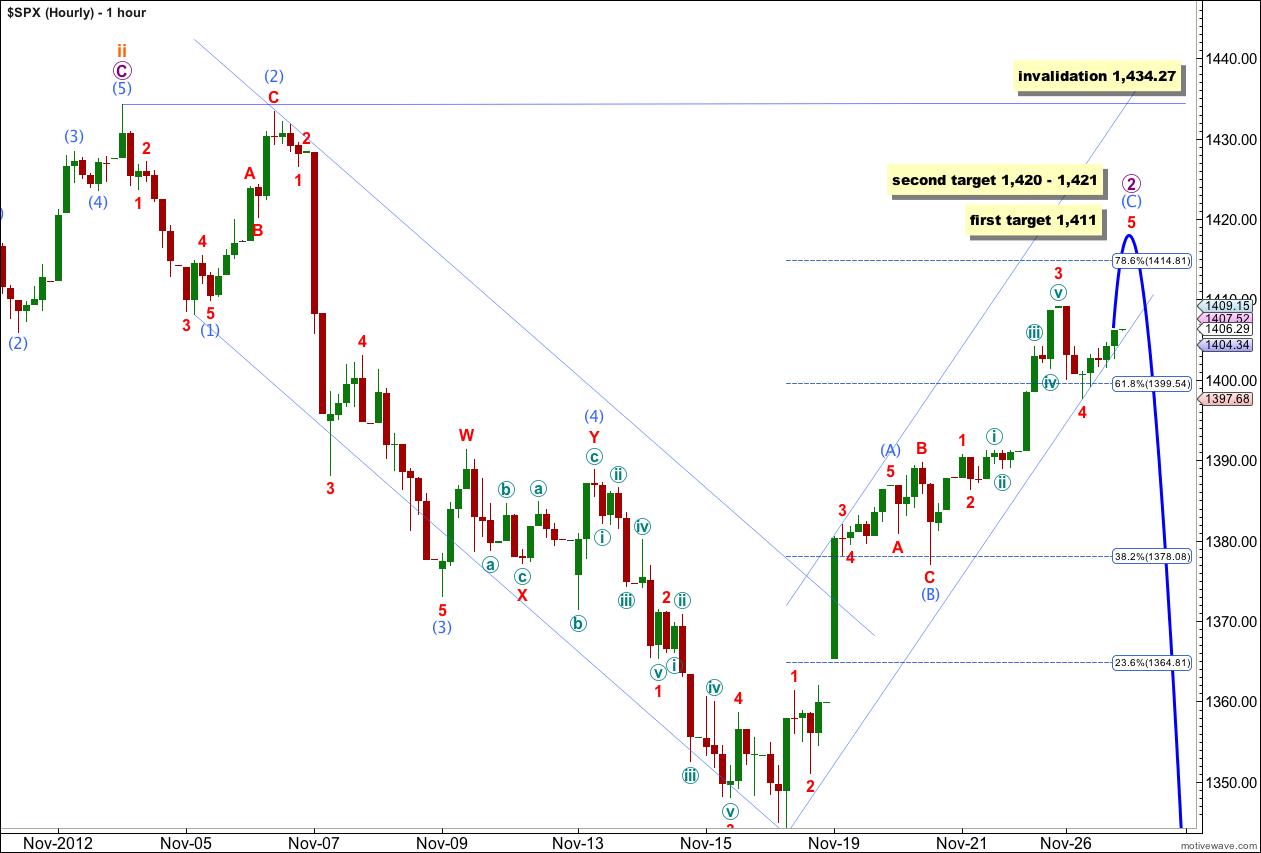
Although price moved lower during Monday’s session wave 4 red remains above the price territory of wave 1 red. The wave count remains valid and still looks typical.
So far to the high labeled wave 3 red the wave count has an impulsive count, and it requires the fifth wave to complete.
On the 5 minute chart wave 5 red is incomplete and looks like it has just begun the third wave within it. I would expect upwards movement tomorrow.
At 1,411 wave 5 red would reach equality in length with wave 1 red. If price keeps rising through this first target then at 1,420 wave 5 red would reach equality in length with wave 3 red, and at 1,421 wave (C) aqua would reach equality in length with wave (A) aqua.
The upwards channel drawn using Elliott’s technique is not containing upwards movement. I have redrawn the cannel as a best fit and this nicely shows us where downwards movement found support during Monday’s session.
Upwards movement would be very likely to end at some time during the next session. Tuesday’s session should see a trend change back to the downside.
Wave 2 purple may not move beyond the start of wave 1 purple. This wave count is invalidated with movement above 1,434.27.
If this wave count is invalidated with upwards movement then the trend change at primary degree will be in doubt.
Hey Lara,
Is it time to give up going over 1409.16? Thanks
Yes.
Thank you Lara!!
John