
As expected from yesterday’s main hourly wave count, which was favoured over the alternate, price has risen during Wednesday’s session towards the first target.
I have still the same single daily wave count for you. Both hourly wave counts remain valid but the main wave count has increased in probability.
Click on the charts below to enlarge.
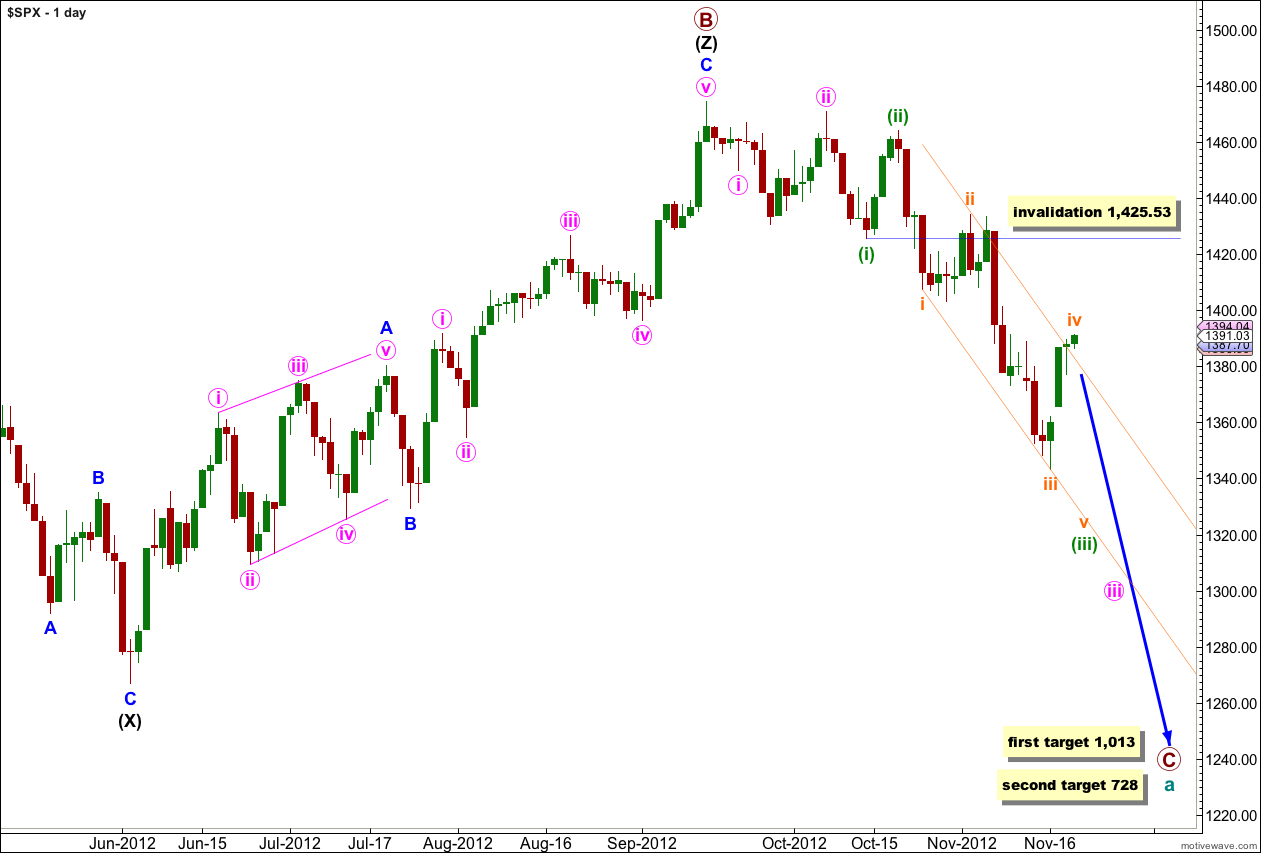
We have recently seen a major trend change in the S&P 500 and the DJIA. This wave count sees the trend at primary degree, so targets are long term and they are months away.
Within the new downwards trend the upcoming wave (iv) green may not move into wave (i) green price territory. This wave count is invalidated at this stage with movement above 1,425.53.
Downwards movement looks most likely to be a series of overlapping first and second waves, with the middle of the third wave complete. We shall expect overall downwards movement with fourth wave corrections to come.
Cycle wave a is an expanded flat correction: primary wave A was a three wave structure, and primary wave B was a triple zigzag and 140% the length of primary wave A.
At 1,013 primary wave C would reach 1.618 the length of primary wave A. If price continues downwards through this first target then the next target is at 728 where primary wave C would reach 2.618 the length of primary wave A.
Today I have two hourly wave counts again for you. The first follows on directly from yesterday’s hourly wave count, the second is new.
Main Hourly Wave Count.
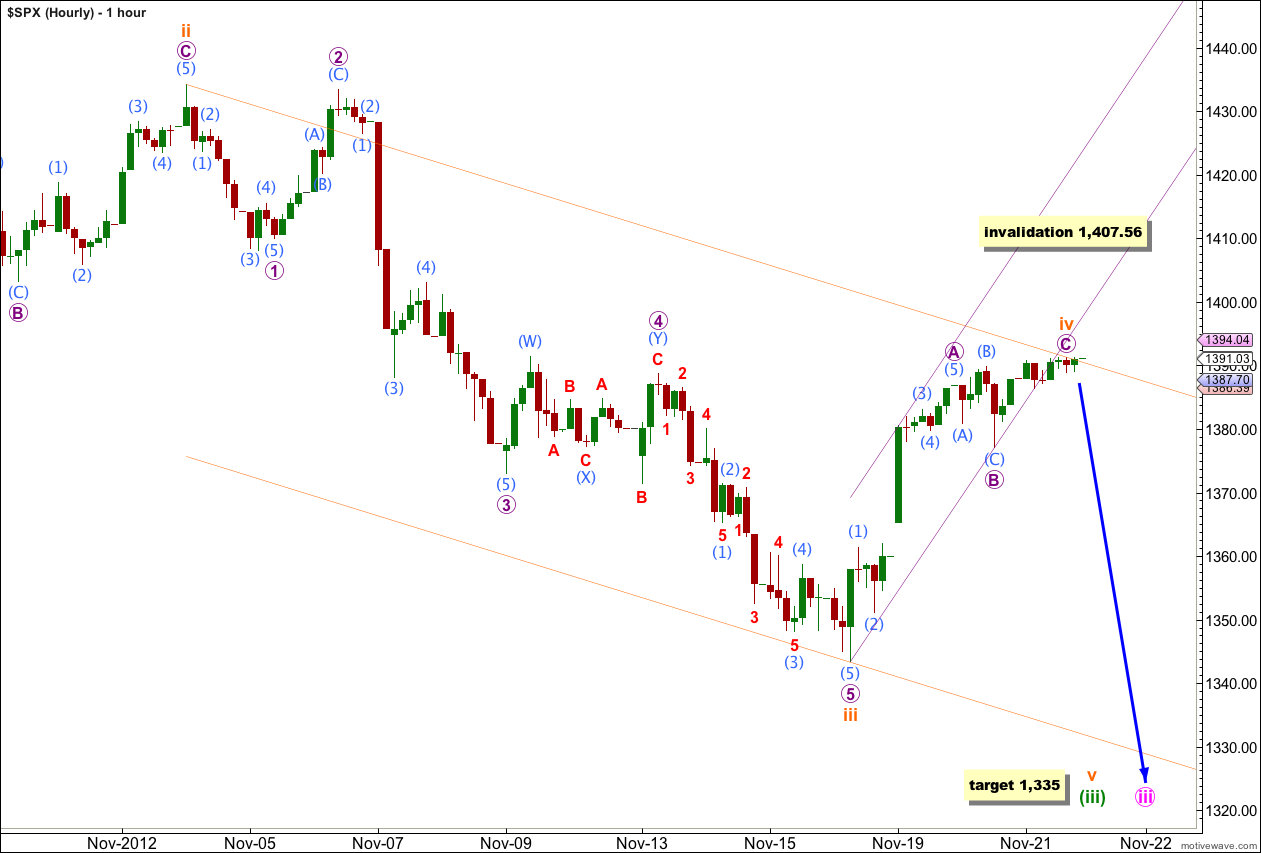
Upwards movement during Wednesday’s session subdivides perfectly on the 5 minute chart into a nice five wave impulse. Wave C purple must subdivide into a five, and it is entirely possible that it is over here in just 3 sessions (a Fibonacci number).
At the end of Wednesday’s session there is not enough downwards movement to confirm that the final fifth wave within wave C purple is over. If we see movement below 1,388.39 in the next session (the start of the fifth wave within wave C purple) then the probability that wave C purple is complete will increase.
There is no Fibonacci ratio between waves A and C purple.
When we use Elliott’s channelling technique about this zigzag for wave iv orange we can see that it is now breached by the last three hourly candles. This is some indication that wave iv orange may be over and wave v orange may have just begun.
I have redrawn the parallel channel about wave (iii) green; the first trend line is drawn from the highs of waves ii to iv orange and a parallel copy is placed upon the low of wave iii orange. Wave v orange may end either mid way within the channel (more likely) or about the lower edge of the channel (less likely).
At 1,335 wave v orange would reach equality with wave i orange. However, there is already an excellent Fibonacci ratio between waves i and iii orange and I would not necessarily expect to see a ratio between wave v orange and either of i or iii. The target will be recalculated when we have subwaves 1 through to 4 purple within wave v orange complete as this wave degree may give us a more accurate target.
While price is above 1,388.39 I will leave the invalidation point at 1,407.56 and allow for a little more upwards movement for wave C purple of wave iv orange. Wave iv orange may not move into wave i orange price territory.
Alternate Hourly Wave Count.
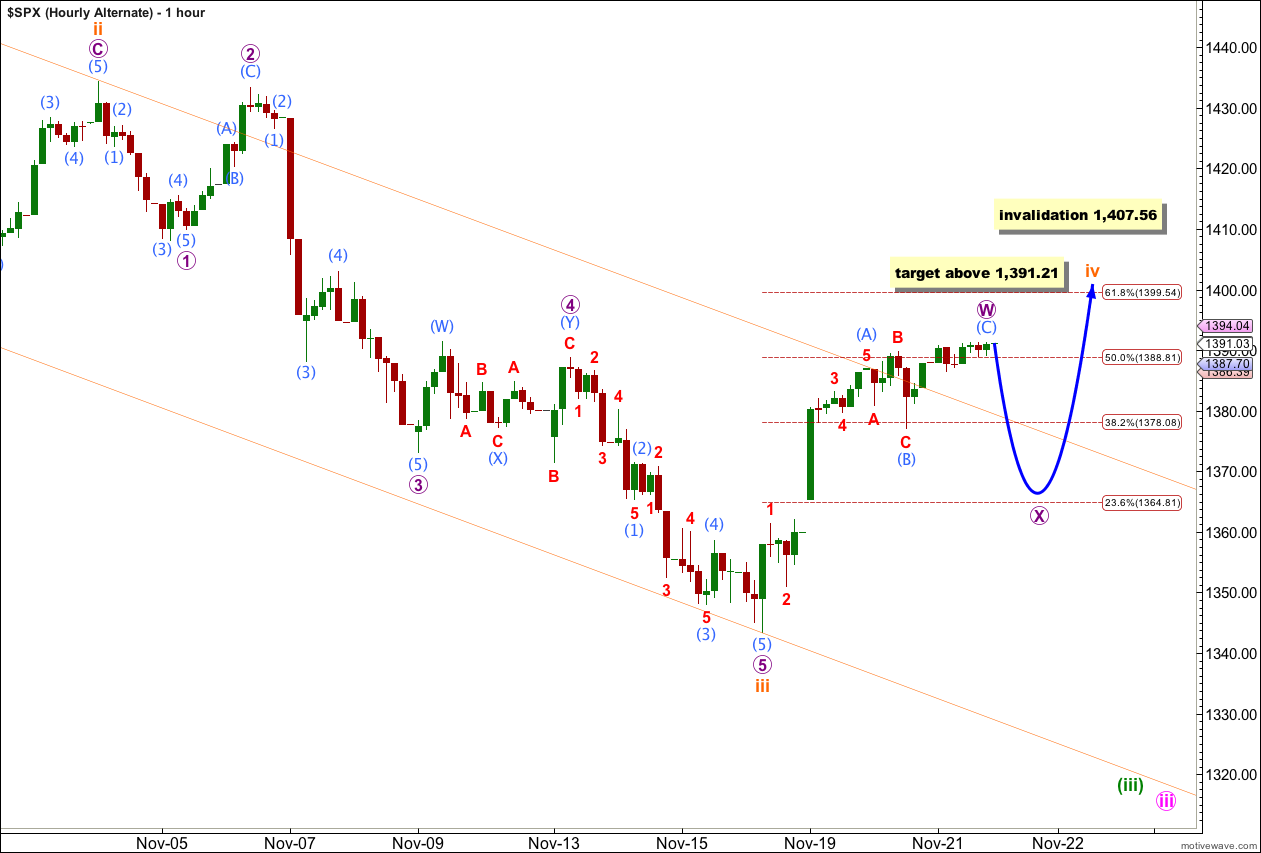
If we simply move the degree of labeling within this upwards zigzag all down one degree this may have been the first structure of a double zigzag or double combination for wave iv orange, labeled wave W purple.
This alternate wave count also sees downwards movement in the next one to three sessions as most likely, but for this alternate it would subdivide into a three wave structure for wave X purple. Movement would be choppy and overlapping.
Thereafter, this alternate sees a second corrective structure yet to unfold as wave Y purple which may be either another zigzag, a flat or a triangle, and may move price above the end of wave W purple possibly to end about the 0.618 Fibonacci ratio of wave iii orange.
Wave X may make a new low below the start of wave W purple. However, there can be no downwards invalidation point for this alternate and careful attention to structure would be required to determine if this alternate is correct in the event of a new low.
This wave count has a reasonable probability, but it is lower than the main hourly wave count for the following reasons:
– if wave iv orange is a zigzag (the most likely structure given the guideline of alternation) it is highly likely to be shorter in duration than its counterpart wave ii orange.
– wave iv orange is now over 50% of wave iii orange and is a relatively deep correction in comparison to wave ii orange giving us nice alternation in depth.
– wave iv orange has already overshot the parallel channel (that’s okay, sometimes fourth waves do that) but were it to continue sideways and higher the overshoot would be much bigger and this overall look would have a lower probability.
To the upside the invalidation point is the same. Wave iv orange may not move into wave i orange price territory above 1,407.56.
Is possible wave 2 start which will overtake 1407?
Dear Lara,
alternate hourly wave count:
When you says that wave X has to unfold in a three wave structure, it could be also a triangle wich is a 5 corrective structure.
I like very much the way you justify and comment the wave count, very good job.
Regards,
Emmanuel
Yes, you are correct.
For EW purposes when I say “three” what I probably should be saying is “corrective structure” because this then would include triangles.
I only really worry about triangles if they show themselves though, in my experience they’re not especially common. Zigzags, flats and doubles are more common.
Thank you! My purpose in explaining the wave count is for members to learn as much as possible. By repetition over time you will eventually be able to do this yourself, and you won’t need me anymore.