
Yesterday’s analysis expected sideways and downwards movement for Tuesday’s session which is what happened. The structure on the hourly chart is unfolding as expected.
I have still just the one daily chart for you. Today I have two hourly charts which look at Tuesday’s movement differently; the structure is the same but the degree of labeling differs.
Click on the charts below to enlarge.

We have recently seen a major trend change in the S&P 500 and the DJIA. This wave count sees the trend at primary degree, so targets are long term and they are months away.
Within the new downwards trend the upcoming wave (iv) green may not move into wave (i) green price territory. This wave count is invalidated at this stage with movement above 1,425.53.
Downwards movement looks most likely to be a series of overlapping first and second waves, with the middle of the third wave complete. We shall expect overall downwards movement with fourth wave corrections to come.
Cycle wave a is an expanded flat correction: primary wave A was a three wave structure, and primary wave B was a triple zigzag and 140% the length of primary wave A.
At 1,013 primary wave C would reach 1.618 the length of primary wave A. If price continues downwards through this first target then the next target is at 728 where primary wave C would reach 2.618 the length of primary wave A.
Main Hourly Wave Count.
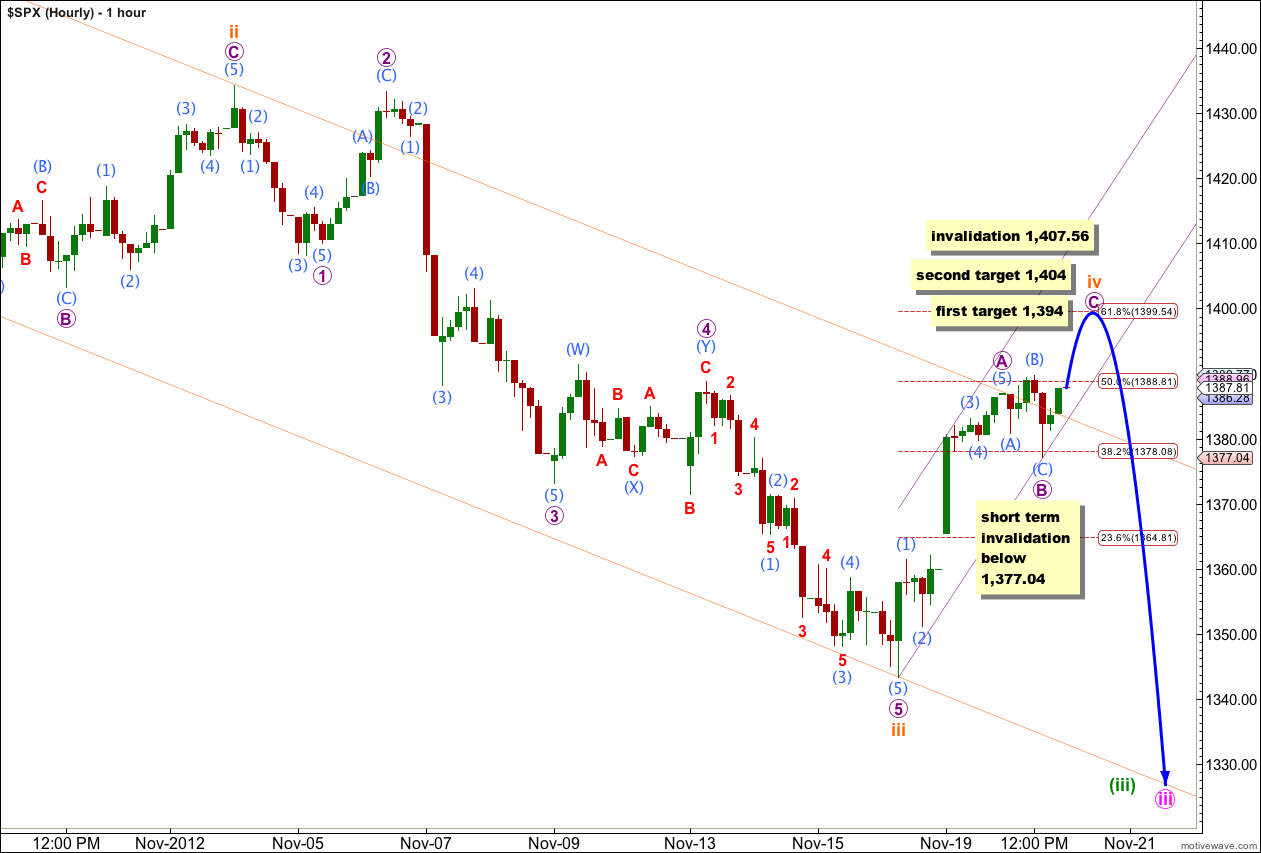
Wave B purple may have lasted one session as an expanded flat correction. Within it wave (B) aqua is a 147% correction of wave (A) aqua, and wave (C) aqua has no Fibonacci ratio to wave (A) aqua.
On the 5 minute chart the subdivisions of this structure are perfect; waves (A) and (B) aqua subdivide into threes, and wave (C) aqua subdivides into an obvious five wave impulse.
If this degree of labeling is correct then wave B purple is over and wave C purple has begun. So far wave C purple has moved price beyond the end of wave A purple, avoiding a truncation. At 1,394 wave C purple would reach 0.382 the length of wave A purple. If price continues through this first target then the second is at 1,404 where wave C purple would reach 0.618 the length of wave A purple.
This main hourly wave count expects upwards movement tomorrow. Within wave (C) aqua no second wave correction may move beyond the start of its first wave. This wave count is invalidated tomorrow if price moves below 1,377.04, in which case the alternate below should be used.
We may now draw a channel about wave iv orange using Elliott’s technique for a correction. Draw the first trend line from the start of wave A purple to the low labeled wave B purple, then place a parallel copy upon the high of wave A purple and push it out to include all of wave A. Wave C purple may end either mid way within the channel or about the upper edge.
It looks like wave iv orange will end with a clear overshoot of the downwards sloping channel drawn about wave (iii) green here and on the daily chart. We should use the smaller upwards sloping channel about wave iv orange here to indicate where this movement may end.
Wave iv orange may not move into wave i orange price territory. This wave count is invalidated with movement above 1,407.56.
If we move the degree of labeling for Tuesday’s movement within wave B purple all down one degree then the alternate below would be correct.
Alternate Hourly Wave Count.
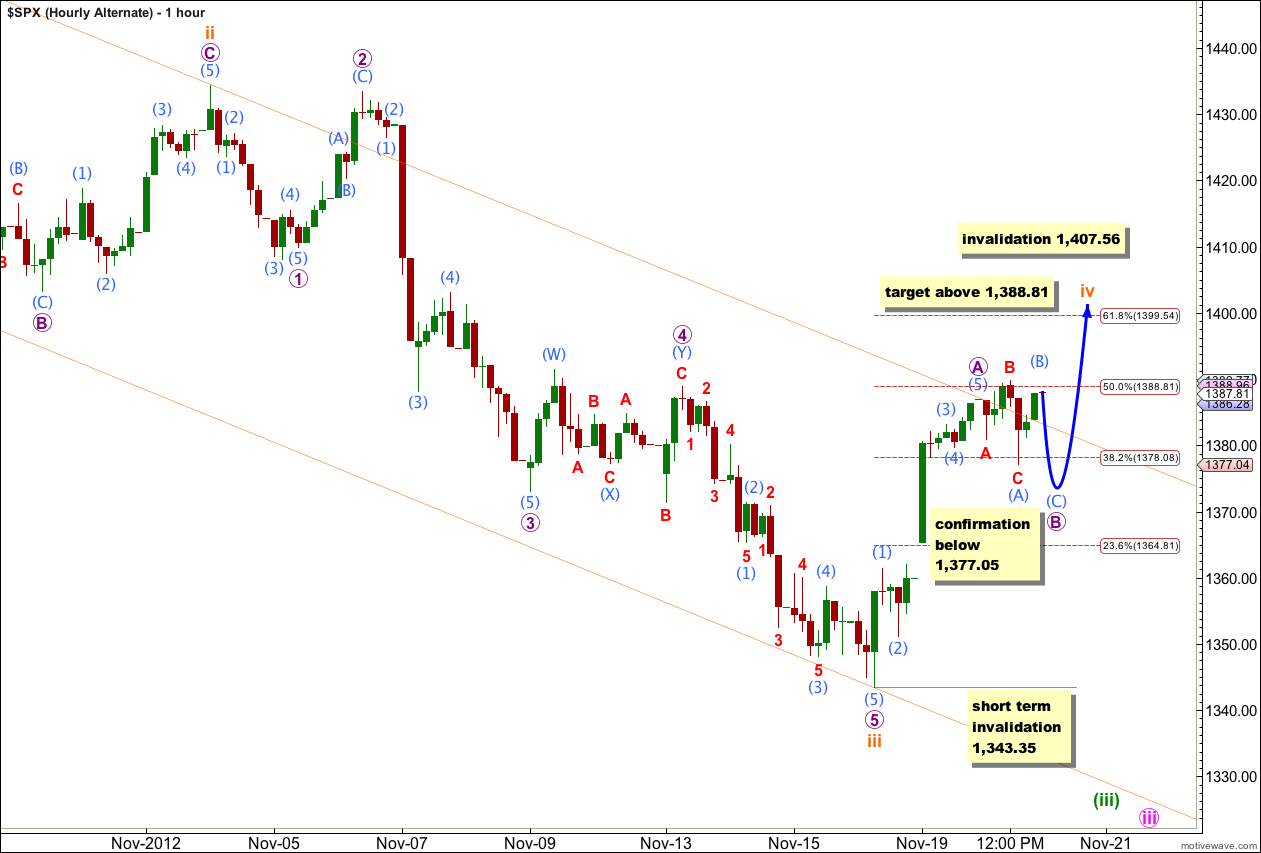
We may have seen only wave (A) aqua within wave B purple complete. This would indicate that wave B purple is still unfolding as a flat correction, because wave (A) aqua within it is a three, but that it may be longer lasting.
Wave (B) aqua may yet move a little higher. If price moves above 1,397 this wave count would be so reduced in probability that it would be discarded. However, prior to that price point the structure of upwards movement would provide a clearer indication as to whether or not this wave count would be viable.
Wave (B) aqua must subdivide as a three wave structure. So far on the 5 minute chart this upwards movement is incomplete so it cannot be determined if it will be a three or a five.
When wave (B) aqua is complete (and it is either very close to completion or would end early in the next session) then wave (C) aqua should take price lower, most likely below the low labeled wave (A) aqua at 1,377.04 to avoid a truncation. Thereafter, wave C purple should move price higher, probably towards the 0.618 Fibonacci ratio.
This wave count overall looks less likely than the main wave count because wave B purple looks slightly out of proportion to the aqua waves within wave A purple. However, it is entirely viable.
Wave B purple may not move beyond the start of wave A purple. This wave count is invalidated with movement below 1,343.35 in the short term.
Wave iv orange may not move into wave i orange price territory. This wave count is invalidated with movement above 1,407.56.