
Last analysis expected a little more downwards movement for Wednesday’s session. Price has moved lower as expected towards the short term target.
The wave count remains the same.
The first and second daily wave counts are different at cycle degree. Members may review monthly charts here.
Click on the charts below to enlarge.
First Daily Wave Count.
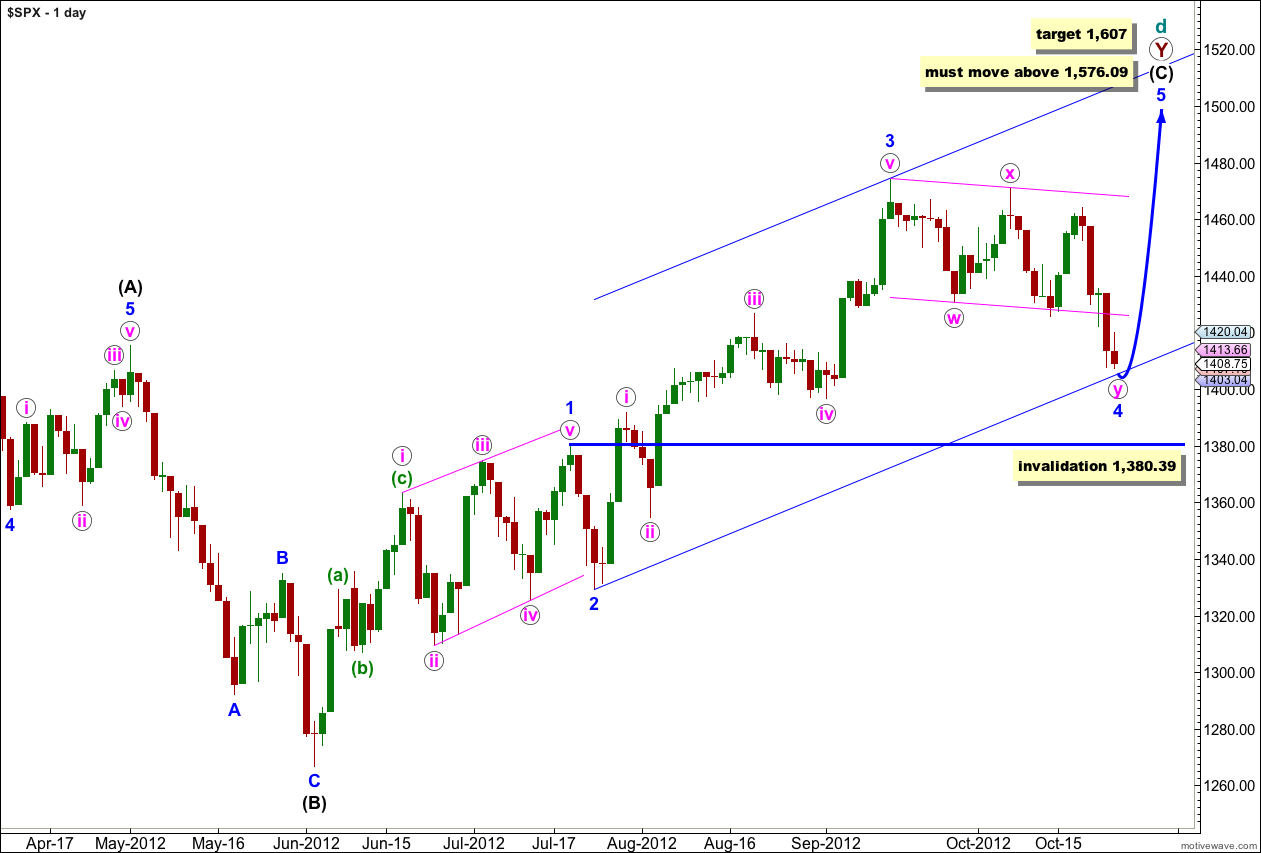
At super cycle degree this wave count sees a very rare expanding triangle unfolding, and cycle wave d upwards within the triangle is a double zigzag which must move beyond the end of cycle wave b.
Within the second zigzag of the double, primary wave Y, wave (C) black must unfold as a five wave structure.
Waves 1 through to 3 blue are complete. Wave 2 blue unfolded as a brief zigzag, and wave 4 blue looks like a double zigzag exhibiting alternation.
Further downwards movement for wave 4 blue may not move into wave 1 blue price territory. This wave count is invalidated with movement below 1,380.39.
At 1,607 wave (C) black would reach equality in length with wave (A) black.
Elliott’s second channeling technique may be used about this impulse of wave (C) black when wave 4 blue is over. The first trend line is drawn from the lows of 2 to 4 blue, then a parallel copy is placed upon the high of wave 3 blue. Wave 5 blue should end either mid way within the channel or about the upper edge.
If this wave count is invalidated with downwards movement below 1,380.39 then the second daily wave count would be correct. At that stage it would be difficult to see how a large expanding triangle could be unfolding. Movement below 1,266.74 would invalidate the expanding triangle scenario at the monthly chart level and at intermediate degree (please see monthly charts here for an explanation of the wave count at higher degrees).
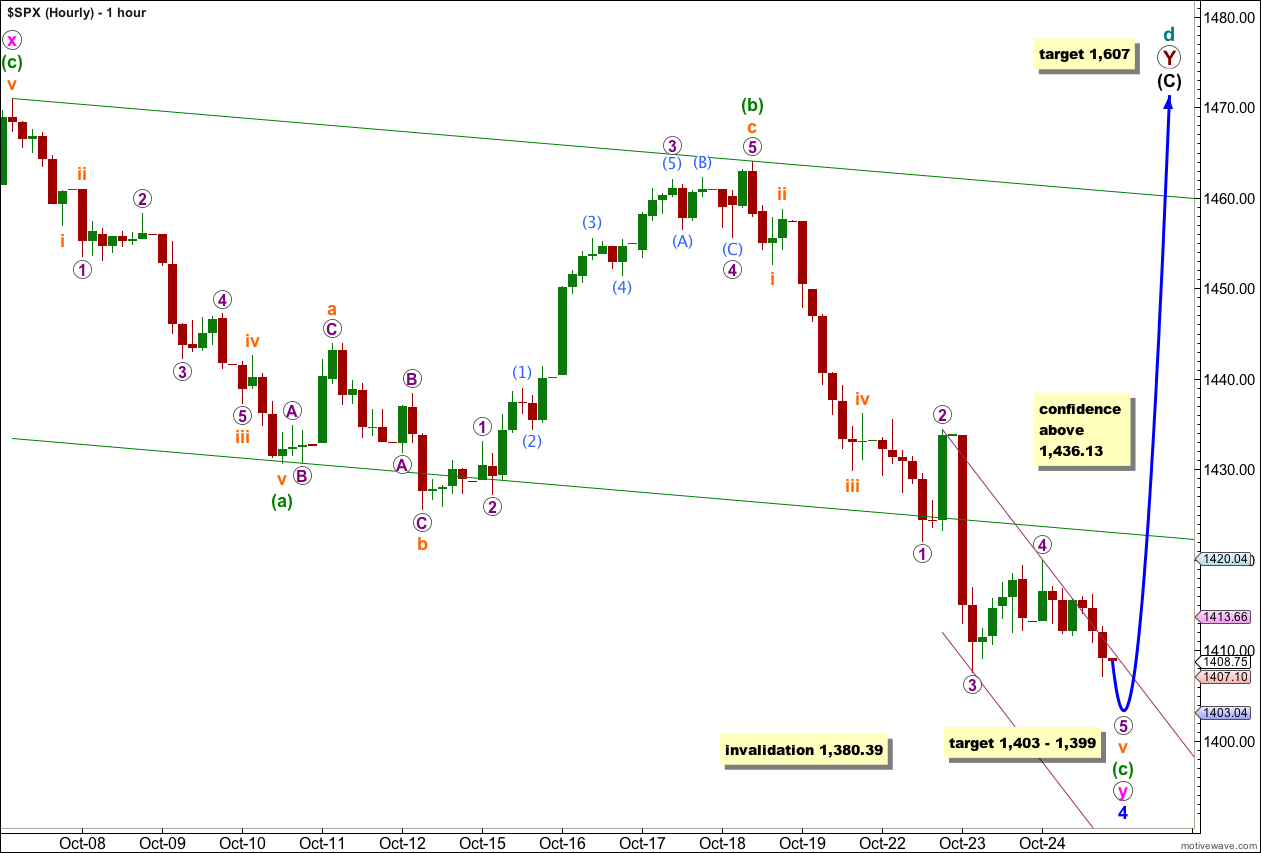
Price has moved lower as expected for Wednesday’s session. The target was not reached. A careful analysis of the 5 minute and 1 minute charts shows that the subdivisions within wave 5 purple are most likely incomplete. Further downwards movement is required.
At 1,403 wave 5 purple would reach 0.618 the length of wave 3 purple.
At 1,399 wave (c) green in its entirety would reach 1.618 the length of wave (a) green. Now that wave (c) green has passed equality with wave (a) green this would be the next target calculation for this degree.
I favour the upper end of this target zone because it is a lower degree. At 1,403 wave (c) green would be within 10% of 1.618 the length of wave (a) green which is an acceptable variation.
Movement above 1,436.13 would confirm wave v orange as over because at that stage upwards movement could not be just a second wave correction.
Movement above the parallel channel containing the zigzag for wave y pink would confirm a trend change.
At 1,607 wave (C) black would reach equality with wave (A) black.
Wave 4 blue may not move into wave 1 blue price territory. This wave count is invalidated with movement below 1,380.39. If this wave count is invalidated by price movement below 1,380.39 we shall use the second daily wave count below.
Second Daily Wave Count.
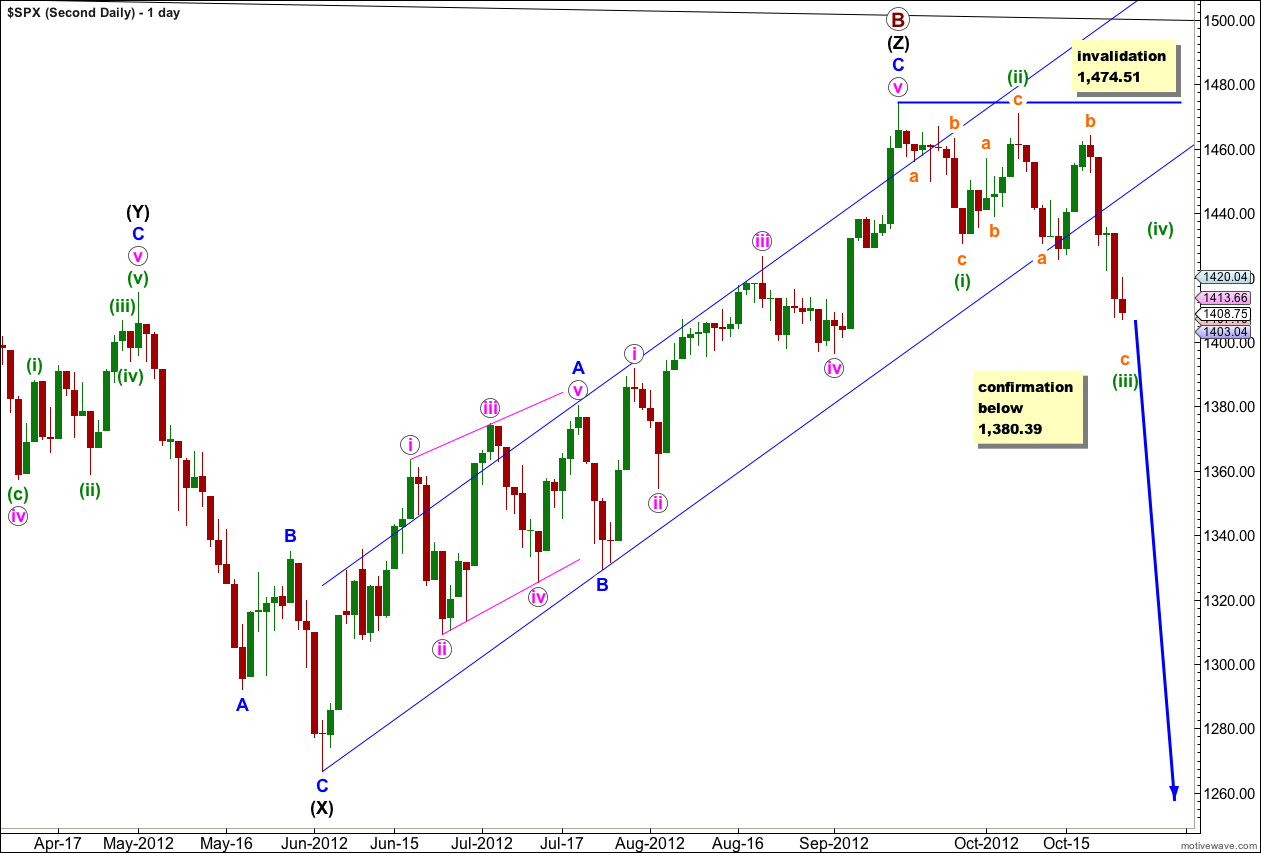
It remains possible that we have recently seen a major trend change in the S&P 500 and the DJIA. We should not place any confidence in this wave count prior to confirmation of a trend change with movement below 1,380.39.
We should always assume that the trend remains the same, until proven otherwise. At this stage we have a little indication of a trend change with a clear channel breach, but we will not have price confirmation until we see movement below 1,380.39 invalidating the first daily wave count.
The upper black line is the upper edge of a parallel channel drawn on the monthly chart. This area may have provided resistance.
The channel drawn about the zigzag of wave (Z) black using Elliott’s technique for a correction is very clearly breached. This is some indication that this wave count may be correct and we may have seen a trend change.
Within the new downwards trend no second wave correction may move beyond the start of the first wave. This wave count is invalidated with any movement above 1,474.51.
If we are in a new downwards trend then it may be an unfolding leading diagonal. Waves (i) through to (iii) green subdivide into a zigzags.
Alternatively, we may have seen a series of overlapping first and second waves. If downwards movement increases in momentum it could be the middle of a strong third wave unfolding.
If price breaks below 1,380.39 then this would be the preferred wave count and we should expect a new downwards trend for months. At that stage I would calculate downwards targets for you. To do so prior to confirmation would be premature.