
Last analysis expected upwards movement. The invalidation point on the hourly chart was quickly breached, however, by strong downwards movement.
The wave count at the daily chart level remains the same and it remains valid. The hourly chart is adjusted.
Click on the charts below to enlarge.
First Daily Wave Count.
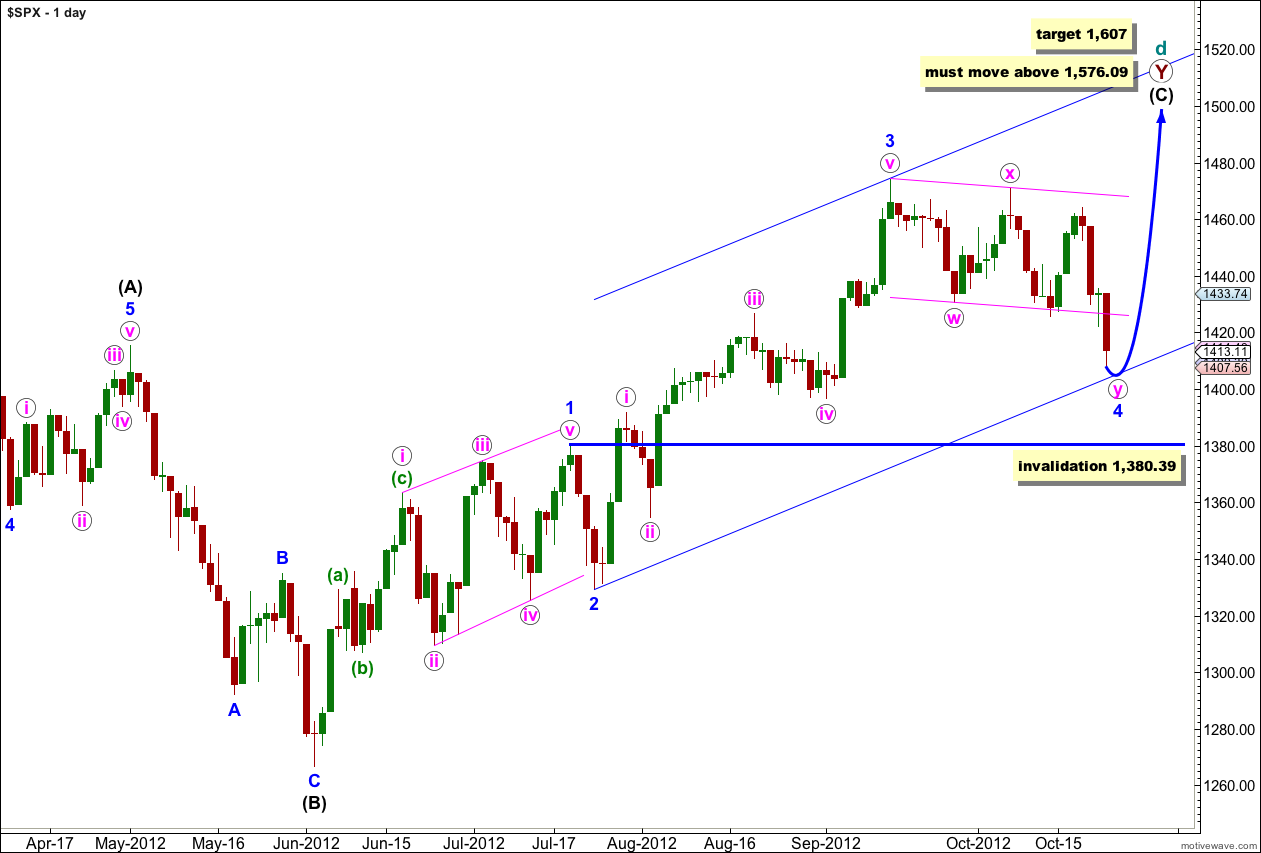
At super cycle degree this wave count sees a very rare expanding triangle unfolding, and cycle wave d upwards within the triangle is a double zigzag which must move beyond the end of cycle wave b.
Within the second zigzag of the double, primary wave Y, wave (C) black must unfold as a five wave structure.
Waves 1 through to 3 blue are complete. Wave 2 blue unfolded as a brief zigzag, and wave 4 blue looks like a double zigzag exhibiting alternation.
Further downwards movement for wave 4 blue may not move into wave 1 blue price territory. This wave count is invalidated with movement below 1,380.39.
At 1,607 wave (C) black would reach equality in length with wave (A) black.
Elliott’s second channeling technique may be used about this impulse of wave (C) black when wave 4 blue is over. The first trend line is drawn from the lows of 2 to 4 blue, then a parallel copy is placed upon the high of wave 3 blue. Wave 5 blue should end either mid way within the channel or about the upper edge.
If this wave count is invalidated with downwards movement below 1,380.39 then the second daily wave count would be correct. At that stage it would be difficult to see how a large expanding triangle could be unfolding. Movement below 1,266.74 would invalidate the expanding triangle scenario at the monthly chart level and at intermediate degree.
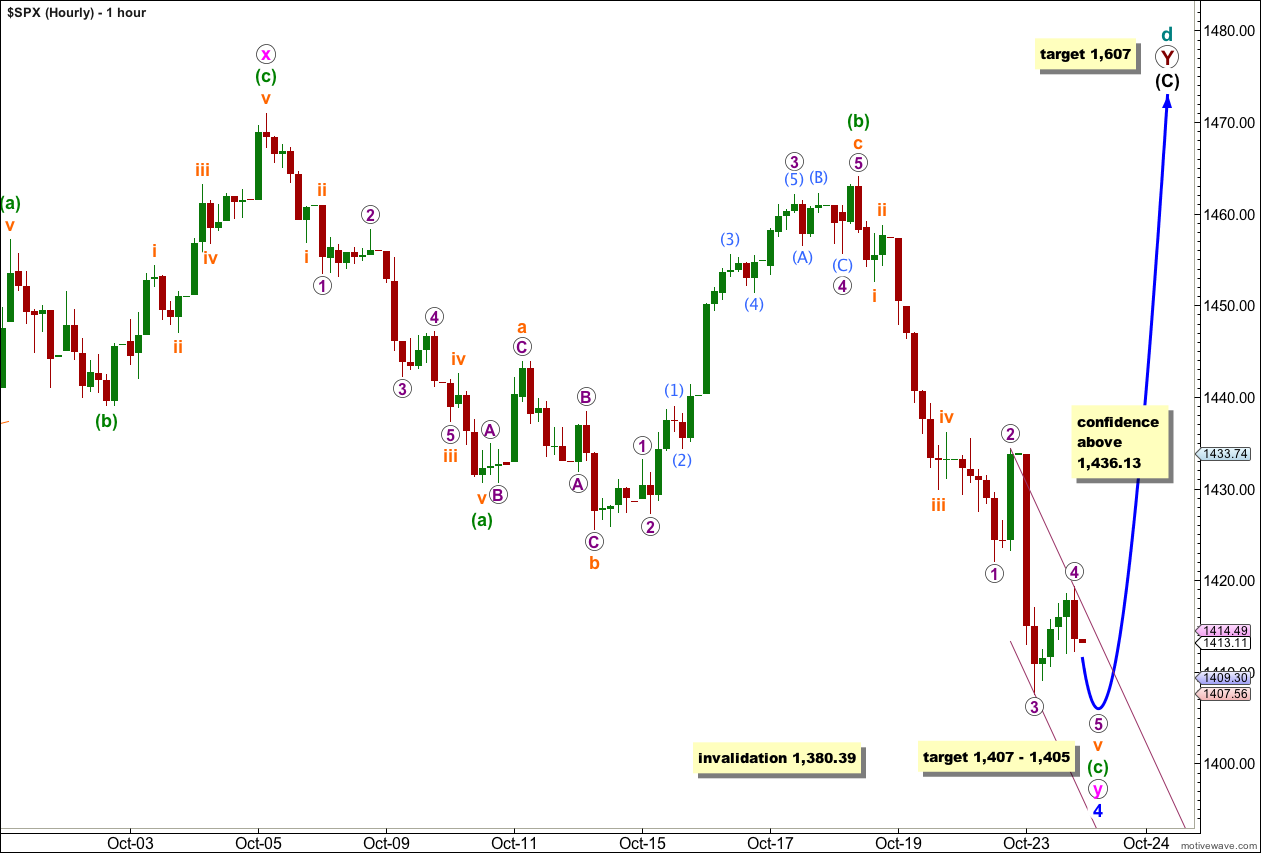
The last wave downwards, wave v orange, within wave (c) green looks like it too is extending. We did not see movement above the first confirmation point at 1,436.13 which would have indicated an end to wave v orange.
Yesterday’s invalidation of the wave count is a good illustration of why I provide confidence points. If price does not move beyond any confidence point then I have less confidence in calling a high or low in place, according to Elliott wave rules. Once price moves beyond each confidence point then the wave count increases in probability.
At 1,407 wave v orange would reach equality in length with wave iii orange. At 1,405 wave 5 purple within wave v orange would reach equality in length with wave 1 purple.
I favour the lower end of this target zone because so far there is no Fibonacci ratio between waves 1 and 3 purple, indicating a higher probability that wave 5 purple will exhibit a Fibonacci ratio to either of 1 or 3. Between waves i and iii orange there already exists a good Fibonacci ratio, indicating a lower probability that wave v orange would exhibit a ratio to either of i or iii orange.
We may use Elliott’s channeling technique about wave v orange extension. Draw the first trend line from the highs of 2 to 4 purple and place a parallel copy upon the low of wave 3 purple. Expect wave 5 purple to most likely end mid way within this channel. When the channel is breached by subsequent upwards movement then wave v orange would likely be over.
Movement above 1,436.13 would provide confidence in the idea that we have had a mid term trend change.
Wave 4 blue may not move into wave 1 blue price territory. This wave count is invalidated with movement below 1,380.39.
Second Daily Wave Count.
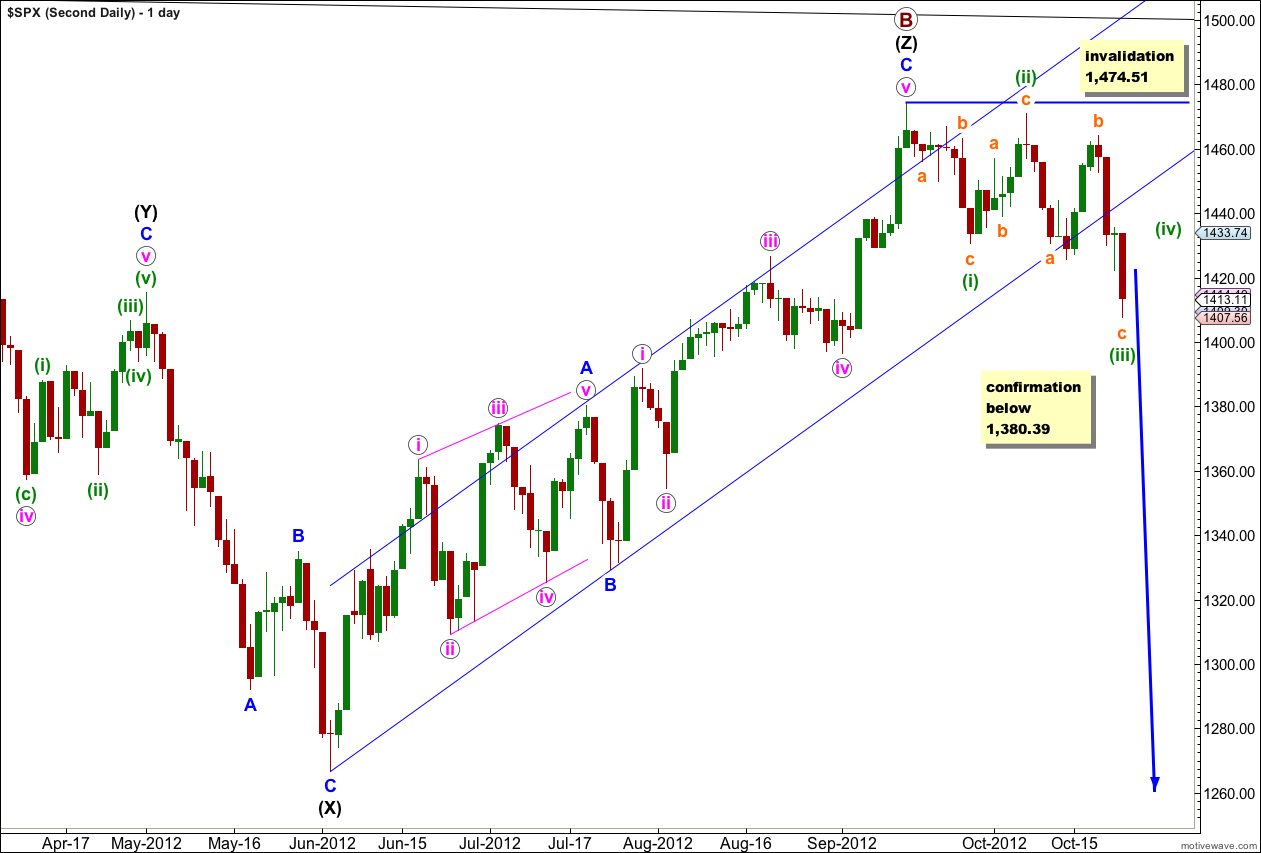
It remains possible that we have recently seen a major trend change in the S&P 500 and the DJIA. We should not place any confidence in this wave count prior to confirmation of a trend change with movement below 1,380.39.
We should always assume that the trend remains the same, until proven otherwise. At this stage we have absolutely no confirmation of a trend change. We will not have confirmation until price moves below 1,380.39 invalidating the first daily wave count.
The upper black line is the upper edge of a parallel channel drawn on the monthly chart. This area may have provided resistance.
The channel drawn about the zigzag of wave (Z) black using Elliott’s technique for a correction is very clearly breached. This is a small indication that this wave count may be correct and we may have seen a trend change.
Within the new downwards trend no second wave correction may move beyond the start of the first wave. This wave count is invalidated with any movement above 1,474.51.
If we are in a new downwards trend then it would be an unfolding leading diagonal. Waves (i) through to (iii) green subdivide into a zigzags.
If price breaks below 1,380.39 then this would be the preferred wave count and we should expect a new downwards trend for months. At that stage I would calculate downwards targets for you. To do so prior to confirmation would be premature.