
Sideways movement during Monday’s session was one of two possibilities expected.
The wave counts both remain mostly unchanged and the targets remain the same.
Although the two wave counts differ at monthly and cycle degree at this stage they do not differ in their mid term expectation for direction.
Monthly charts can be seen here.
Click on the charts below to enlarge.
First Wave Count.
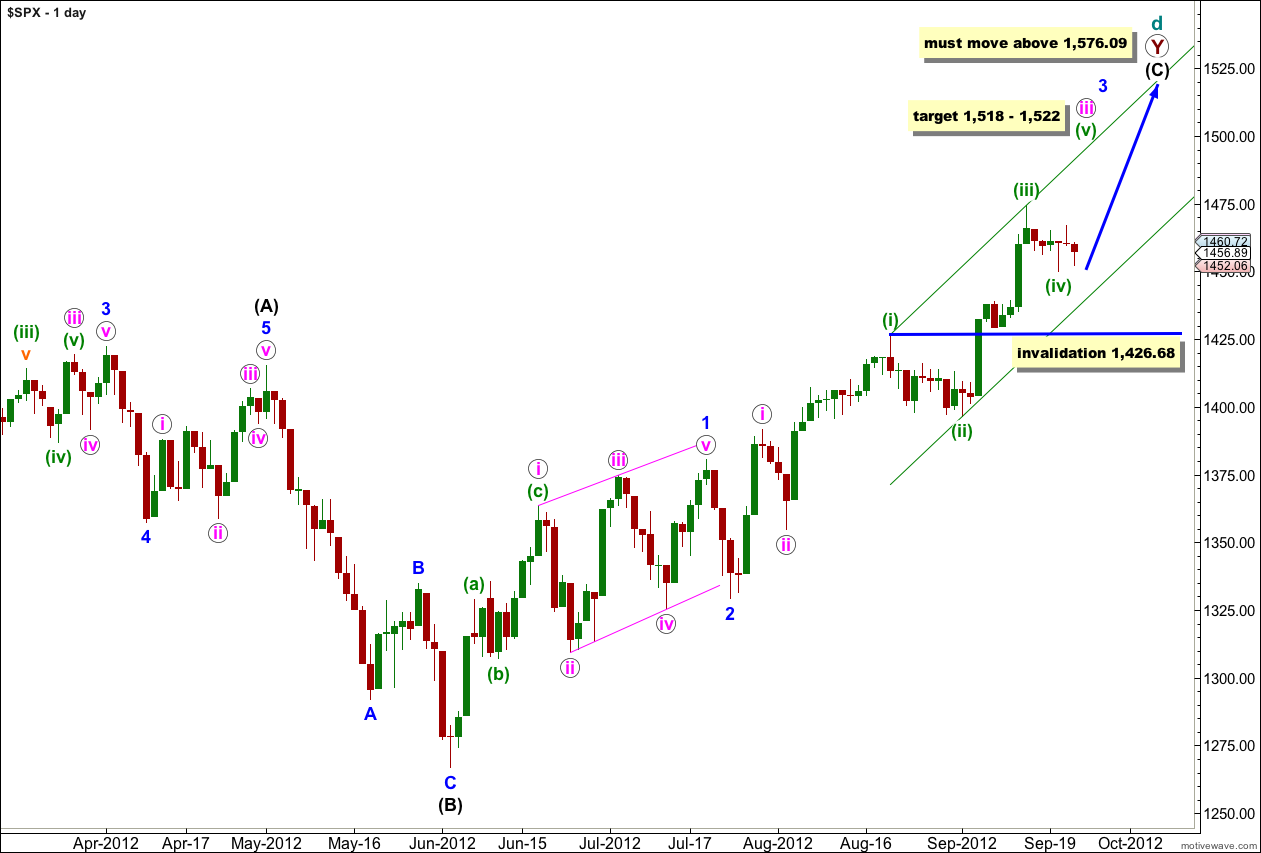
At super cycle degree this wave count sees a very rare expanding triangle unfolding, and cycle wave d upwards within the triangle is a double zigzag which must move beyond the end of cycle wave b.
Within the second zigzag of the double, primary wave Y, wave (C) black must unfold as a five wave structure.
Waves 1 and 2 blue are complete. At this stage wave 3 blue is unfolding upwards as an impulse. When wave 3 blue is complete then we shall expect downwards movement for wave 4 blue. It is at this point that this first wave count diverges from the second wave count. At that stage this first wave count will expect price to not move back into wave 1 blue price territory below 1,380.39 while the second wave count would expect movement below this point. At that stage the price point 1,380.39 will differentiate which wave count is correct.
Within wave 3 blue at 1,518 wave iii pink would reach 2.618 the length of wave i pink.
At 1,522 wave (v) green would reach equality with wave (i) green.
Any further downwards movement for wave (iv) green may not move into wave (i) green price territory. This wave count is invalidated with movement below 1,426.68.
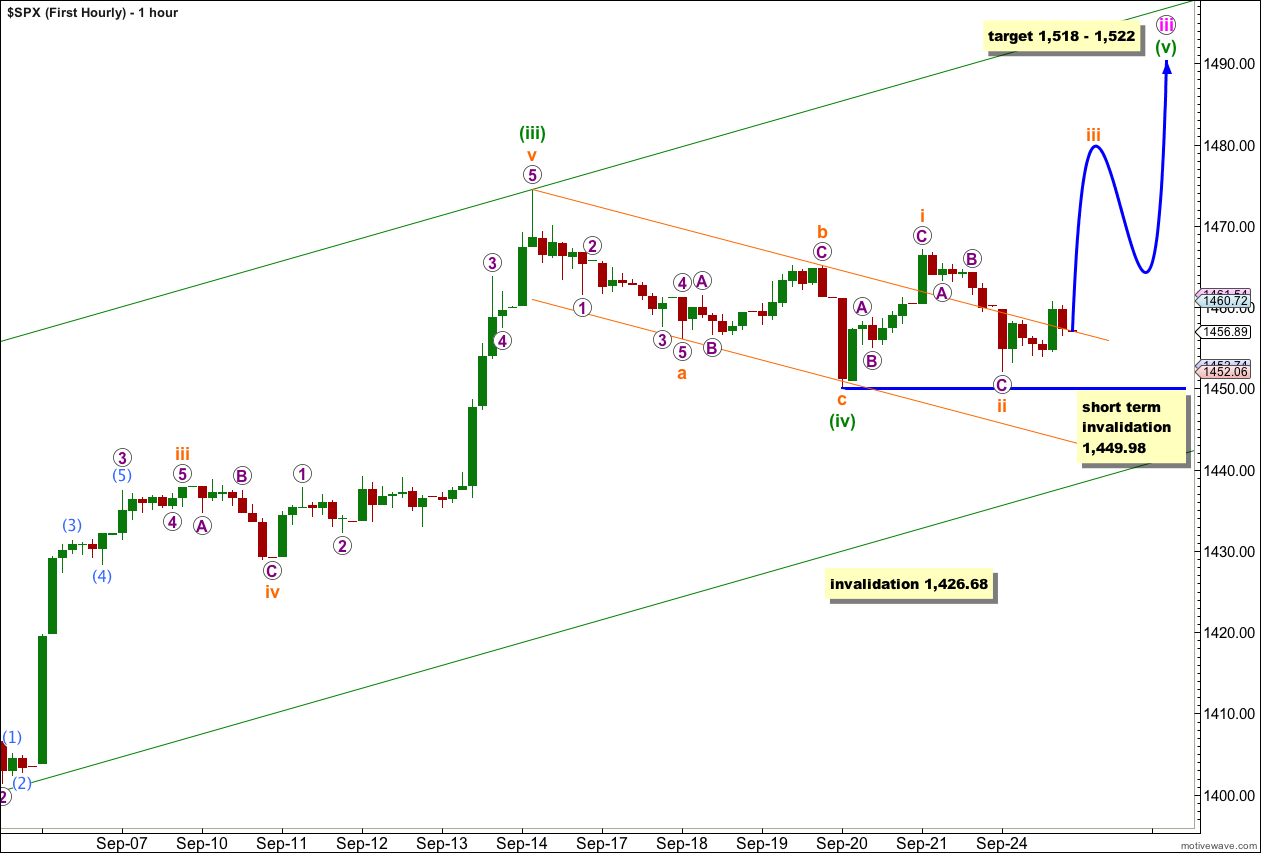
Movement above 1,458.27 invalidated the labeling of wave (v) green as an impulse. Either wave (iv) green is not over or wave (v) green has begun as an ending diagonal. This first hourly chart looks at the possibility that wave (iv) green is over and wave (v) green is an ending diagonal.
An ending diagonal requires all the subwaves to subdivide into zigzags. Wave i orange would be a zigzag. Wave ii orange may not move beyond the start of wave i orange.
This wave count is invalidated with movement below 1,449.98.
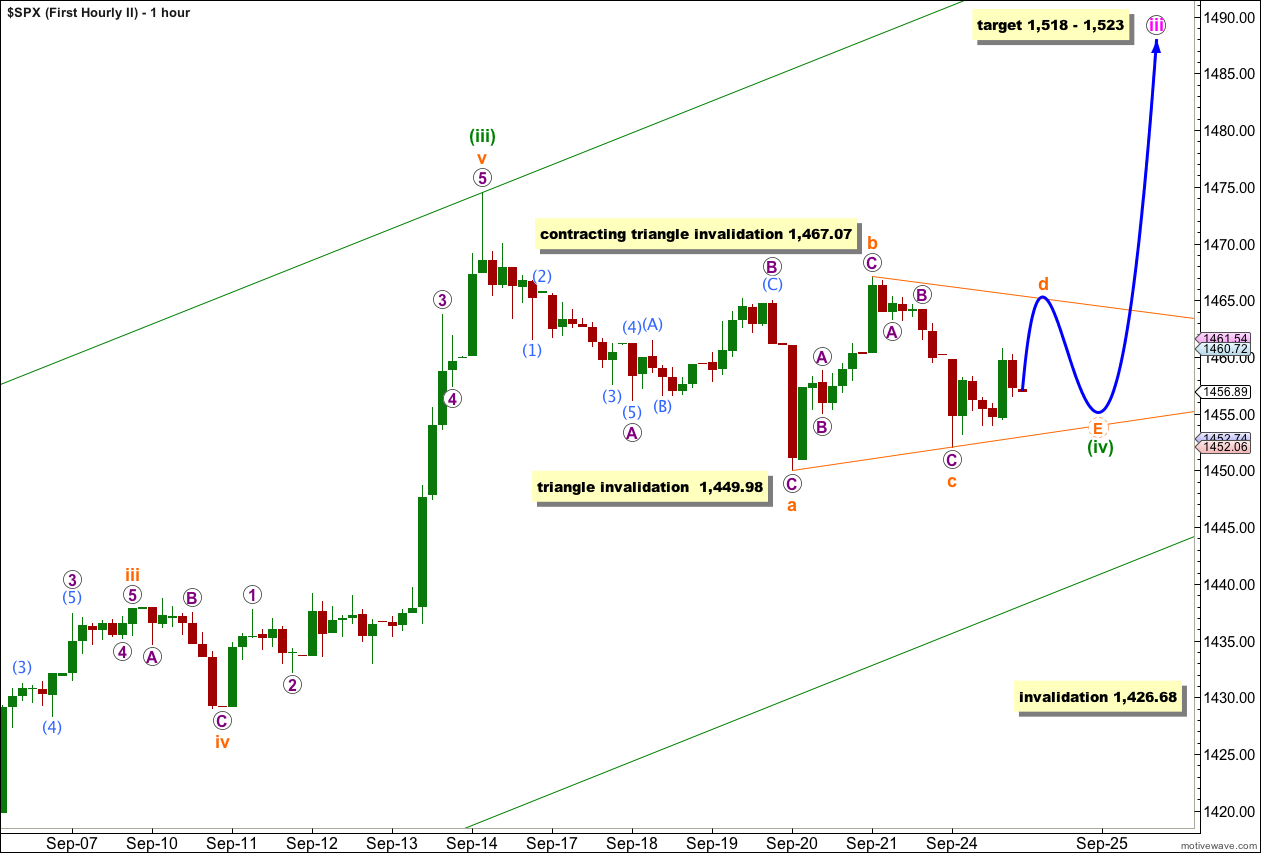
Alternately wave (iv) green may be incomplete. This wave count looks at the possibility that wave (iv) green is continuing further sideways as a triangle.
If the triangle is contracting then wave c orange (if it is incomplete and continuing as a double zigzag) may not move beyond the end of wave a orange. A contracting triangle is invalidated with movement below 1,449.98.
It looks most likely that waves a, b and c orange of the triangle would be complete. Wave d orange looks to be subdividing as a double zigzag. If the triangle is contracting then wave d orange may not move beyond the end of wave b orange. Movement above 1,467.07 would invalidate a contracting triangle.
If the triangle is a barrier triangle then wave d orange would end about the same level as wave b orange, so that the b-d trend line is essentially flat. In practice this means that wave d orange could end very slightly above the end of wave b orange at 1,467.07, but not by very much.
Thereafter, wave e orange downwards may not move beyond the end of wave c orange.
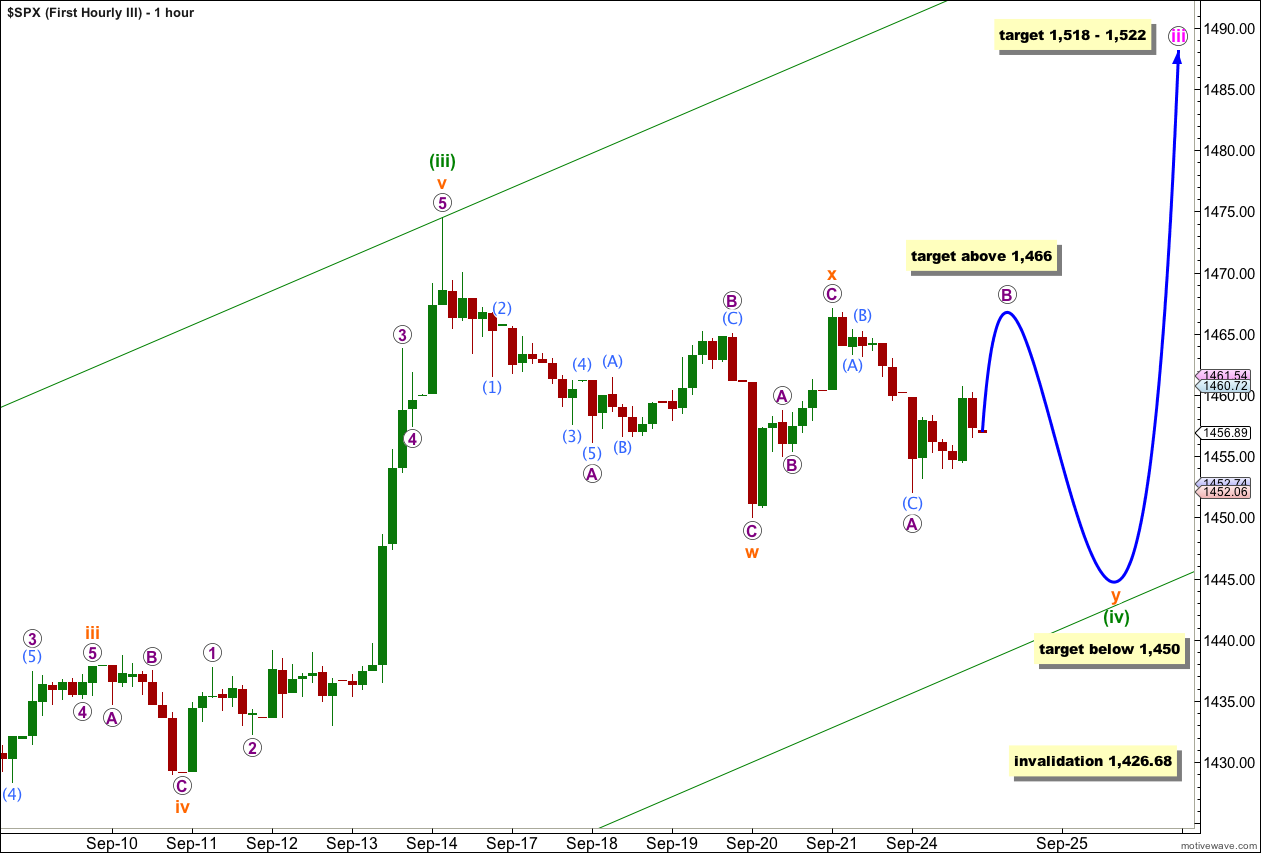
It is also possible that wave (iv) green is continuing further as a double combination. If price moves below 1,449.98 the triangle would be invalidated and a double combination would be the preferred wave count. At that stage I would expect choppy overlapping movement for a few more sessions.
Wave w orange was a zigzag. Wave x orange was a zigzag. Wave y orange may be unfolding as a flat or triangle, or possibly a second zigzag.
Wave y orange is most likely a flat correction because the downwards wave labeled wave A purple within wave y orange subdivides best as a three wave structure on the 5 minute chart.
If wave y orange is a flat correction then wave B purple within it must reach at least 90% the length of wave A purple. This would be achieved at 1,466. Thereafter, wave C purple should move price below the end of wave A purple and most likely below the end of wave w orange at 1,450.
The purpose of double combinations is to move price sideways, not to deepen a correction, so I would not expect significant downwards movement below 1,449.98.
I would expect wave (iv) green to find support at the lower edge of the parallel channel drawn on the daily chart and copied over here.
Wave (iv) green may not move into wave (i) green price territory. This wave count is invalidated with movement below 1,426.68.
Second Wave Count.
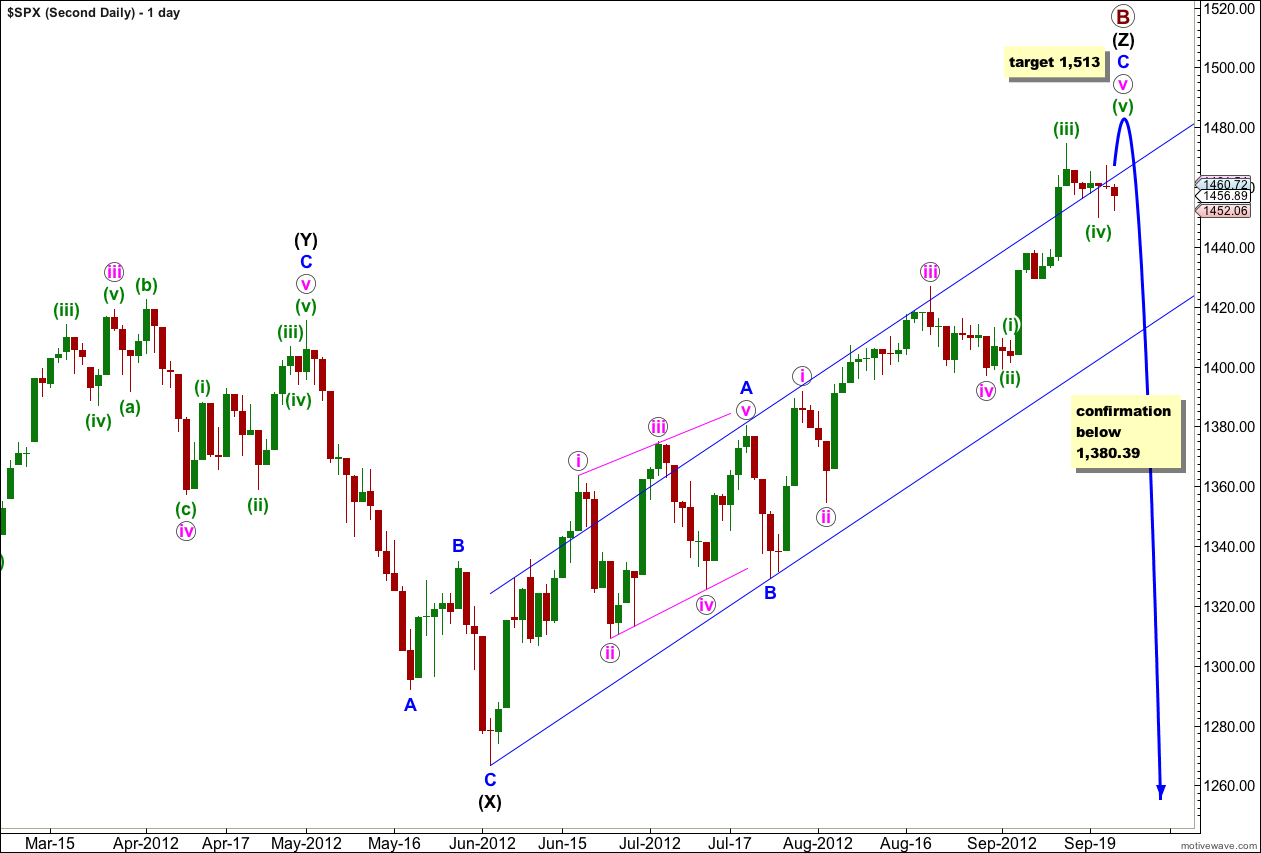
At grand super cycle degree this wave count sees a double flat correction unfolding, which is a common structure. The second flat in the double has begun. Within a flat the A wave must subdivide into a three wave structure, so here at cycle degree a three wave flat is unfolding. Within cycle wave a primary wave A is complete and primary wave B is incomplete.
After the last few days’ sideways movement it looks most likely that primary wave B is incomplete and needs a final fifth wave upwards.
At 1,513 wave C blue would reach 1.618 the length of wave A blue. Also at 1,513 wave v pink within C blue would reach 1.618 the length of wave iii pink. This target has a good probability.
Thereafter, movement below 1,380.39 would take price back into what is wave 1 blue price territory for the first monthly wave count, and that would tip the balance in favour of this second wave count.
At the hourly chart level at this stage both this second wave count and the first wave count are the same. The three hourly charts above will suffice for this wave count also.