
Price moved lower during Thursday’s session, which was expected for all three hourly wave counts, but downwards movement was more than was expected. Both the alternate hourly wave counts are invalid and the main wave count required adjustment. Overall this movement looks like a continuation of the correction I had expected to unfold during Thursday’s session.
I have just one daily and one hourly wave count for you today. At this stage the situation looks clearer.
Click on the charts below to enlarge.
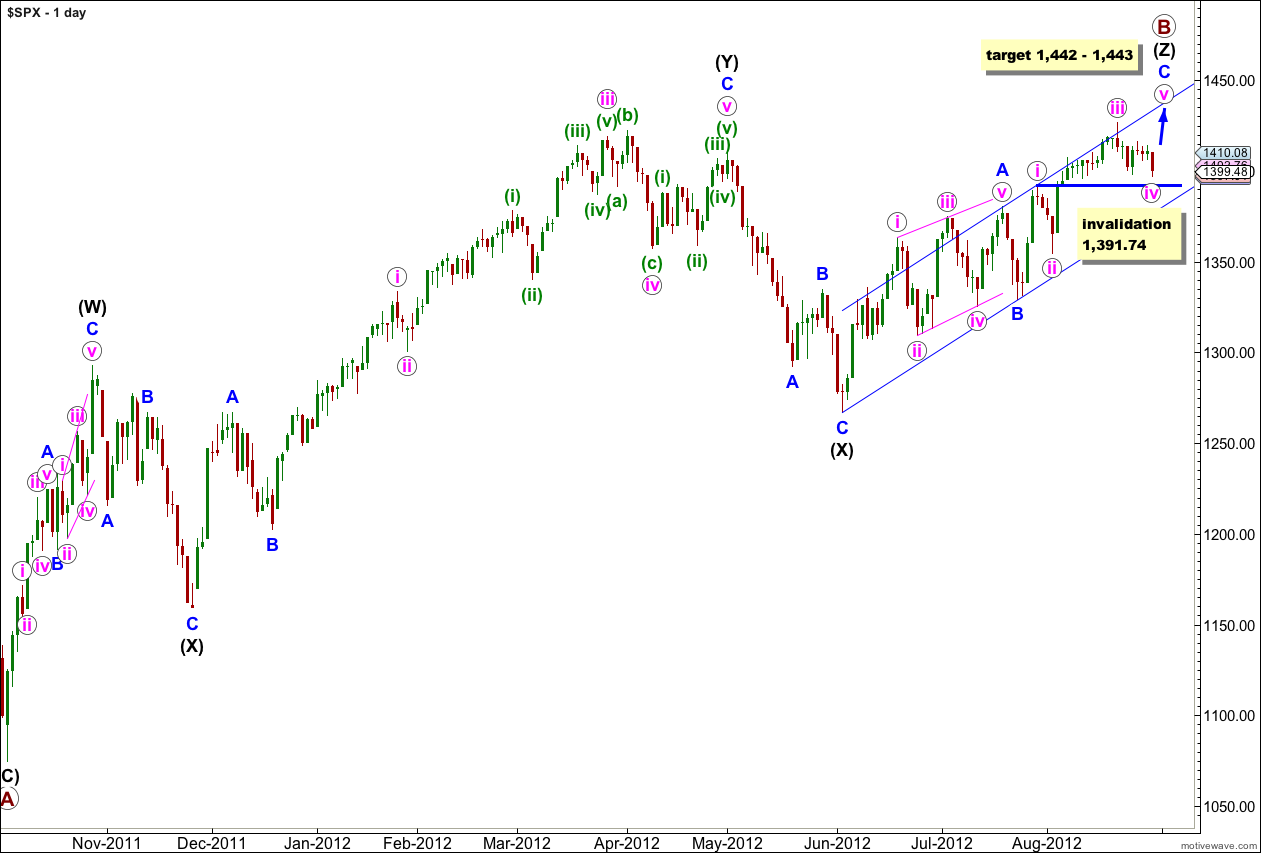
This upwards movement (from the low labeled primary wave A) has a lot of overlapping three wave structures within it. Because the upwards wave labeled intermediate (black) (W) can only be seen as a three wave structure, the only structure that fits for this entire movement within this wave count is a triple zigzag.
The only other Elliott wave structure which has these subdivisions is a leading (or ending) diagonal. This would fit within the second alternate monthly wave count which may be found here. It could also possibly fit as an ending diagonal for the first monthly alternate, the expanding triangle scenario.
Within wave (Z) black wave A blue was a leading contracting diagonal. Wave B blue was a brief zigzag. Wave C blue is exhibiting alternation with wave A blue and unfolding as an impulse.
When the parallel channel about wave (Z) black is clearly breached by downwards movement then we shall have confirmation of a trend change.
Within wave C blue wave iv pink may not move into wave i pink price territory. This wave count is invalidated with movement below 1,391.74.
If price moves below 1,391.74 then the structure within wave C blue must be complete and it would be highly likely that wave Z black would be complete. A triple is the maximum number of corrective structures within a multiple. When the third structure is over the entire correction must be over and there is no way it can continue further.
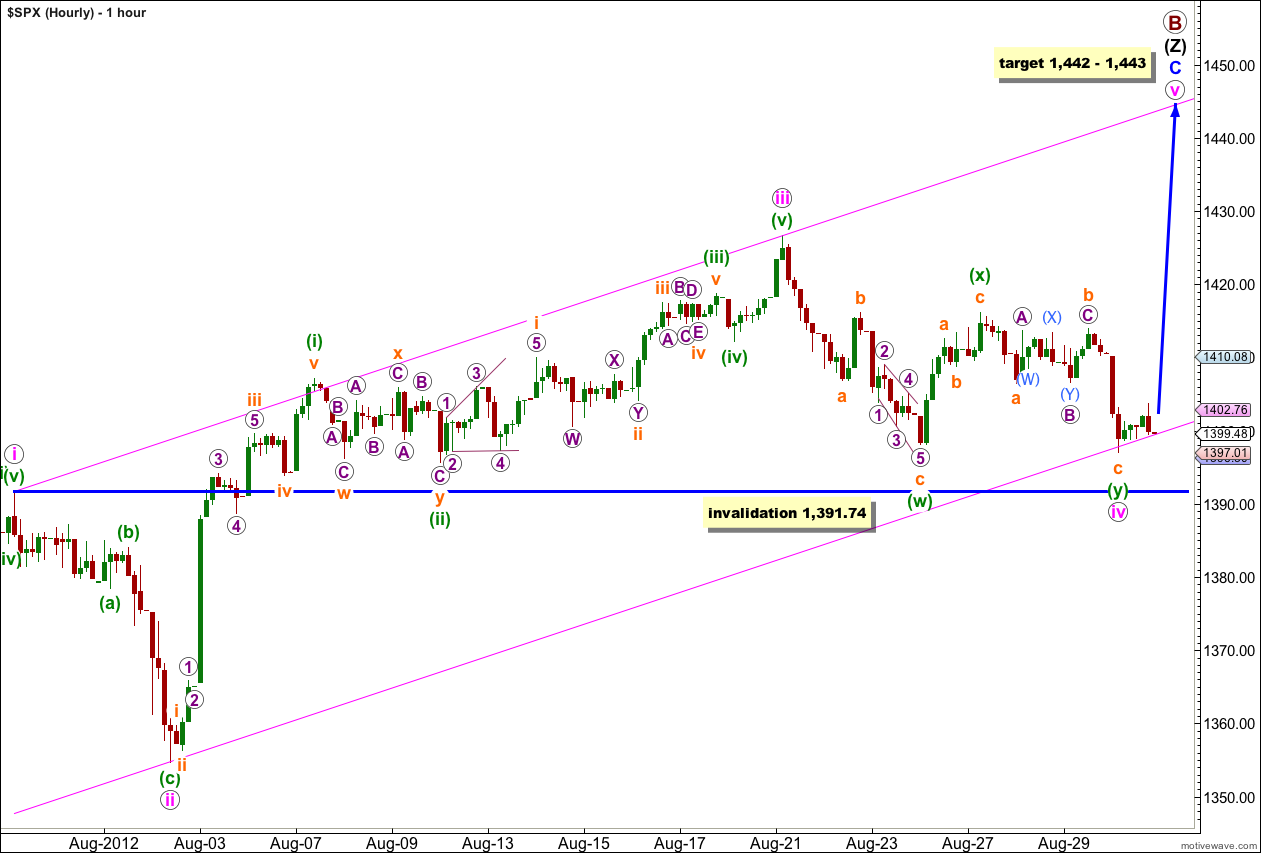
Downwards movement below 1,405.59 invalidated the first alternate hourly wave count, and below 1,398.04 invalidated the second alternate wave count. The triangle structure within the B wave for the main wave count did not complete correctly and was invalidated, and the minimum upwards movement for the main wave count did not occur.
At this stage it looks now like wave iv pink is finally over as a double combination correction. All subdivisions fit on the 5 minute chart. Wave (w) green is a zigzag, wave (x) green is a zigzag, and wave (y) green is a flat correction ending slightly below the end of wave (w) green, essentially moving price sideways which is what a double combination should do.
We now can see perfect alternation between waves ii and iv pink: wave ii pink is a relatively deep zigzag, and wave iv pink is a relatively shallow combination.
Price found support as we expected at the lower end of the parallel channel drawn here on the hourly chart. This point should be where wave v pink is initiated.
At 1,442 wave v pink would reach 0.618 the length of wave iii pink. At 1,443 wave C blue would reach equality in length with wave A blue. This one point target zone has a good probability.
I would expect wave v pink to end either mid way within the parallel channel (more likely) or about the upper edge of the channel (less likely).
Wave v pink should exhibit a slowing of upwards momentum.
Wave v pink should take about 4 to 13 days to unfold. I favour the upper end of this estimation as wave v pink should be slow moving.
Everyone Karen?
Sorry typo ES 1424.75 8/21 top
SPX ES -23.6% Fib 1388.25 is what everyone has been looking from the 1418 top going into next week (double bottom today 1395.25).
Not looking for it to hold…
http://www.cmegroup.com/trading/equity-index/us-index/e-mini-sandp500.html