
Last analysis expected more sideways movement for Wednesday’s session, which is exactly what we have seen. The S&P 500 remains bound within a small range.
I still have just one daily wave count with three alternate hourly wave counts looking at recent movement over the last few days differently. At this stage all three alternate wave counts expect mostly the same movement next. Their invalidation points are close together and the final target is the same.
Click on the charts below to enlarge.
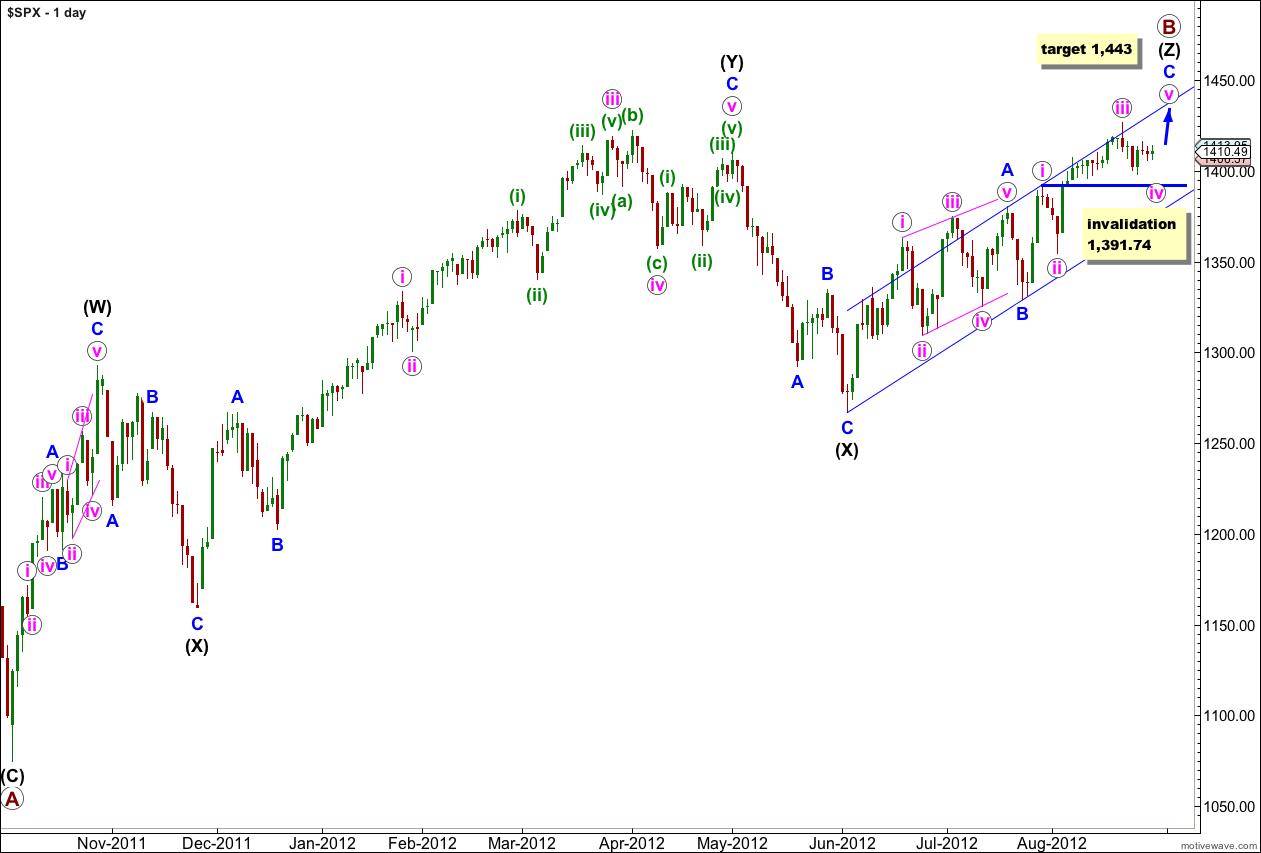
This upwards movement (from the low labeled primary wave A) has a lot of overlapping three wave structures within it. Because the upwards wave labeled intermediate (black) (W) can only be seen as a three wave structure, the only structure that fits for this entire movement within this wave count is a triple zigzag.
The only other Elliott wave structure which has these subdivisions is a leading (or ending) diagonal. This would fit within the second alternate monthly wave count which may be found here. It could also possibly fit as an ending diagonal for the first monthly alternate, the expanding triangle scenario.
Within wave (Z) black wave A blue was a leading contracting diagonal. Wave B blue was a brief zigzag. Wave C blue is exhibiting alternation with wave A blue and unfolding as an impulse.
When the parallel channel about wave (Z) black is clearly breached by downwards movement then we shall have confirmation of a trend change.
Within wave C blue wave iv pink may not move into wave i pink price territory. This wave count is invalidated with movement below 1,391.74. If this wave count is invalidated with downwards movement then I would consider the possibility that we may have seen a trend change and the end of primary wave B.
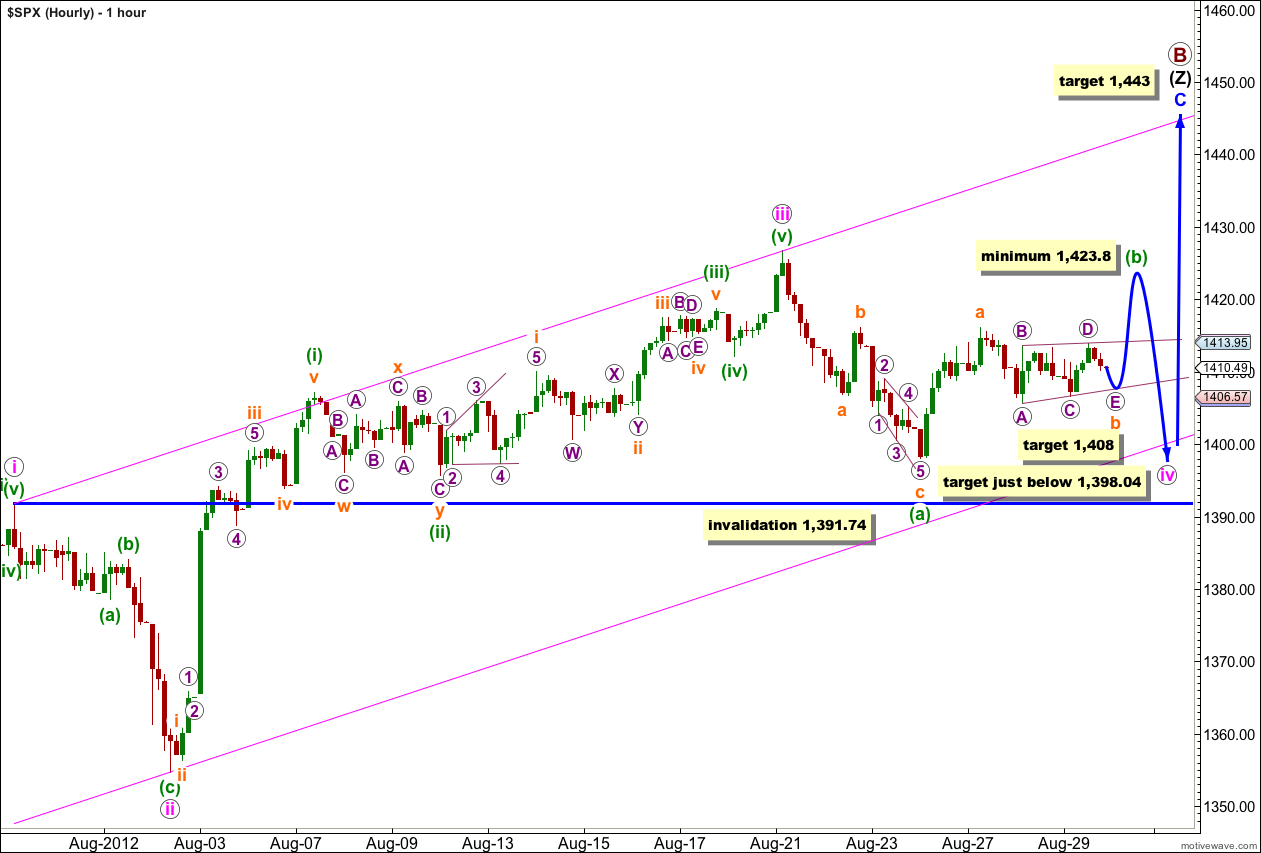
This main hourly wave count has the best fit on the 5 and 1 minute charts.
Within wave (b) green wave a orange is ambiguous and it may be seen as either a three or a five. This wave count sees it as a five.
Within wave b orange we may be seeing a barrier triangle unfold. Wave A purple subdivides best as a three. Wave B purple subdivides well as a three. Wave C purple subdivides as a double zigzag. Wave D purple is highly ambiguous and this wave count sees it as a three.
These overlapping three wave sideways movements fit best as a small triangle, with a double zigzag in the middle as would be expected for a triangle. Wave D purple has ended very slightly (0.32 points) above the end of wave B purple and the B-D trend line is essentially flat.
Wave E purple would reach about 80% of wave D purple at 1,408. Wave E purple may end with either an undershoot or overshoot of the A-C trend line, with most likely an overshoot.
Thereafter, a five wave structure should take price higher to at least 1,423.8 to complete wave (b) green, where it would be 90% the length of wave (a) green. Wave (b) green may make a new high above the start of wave (a) green at 1,426.68 and is actually fairly likely to do so.
This wave count expects sideways movement for the next few days, but with a break out of the very narrow range of the last three sessions to an increased range.
Wave iv pink may not move into wave i pink price territory. This wave count is invalidated with movement below 1,391.74.
First Alternate Hourly Wave Count.
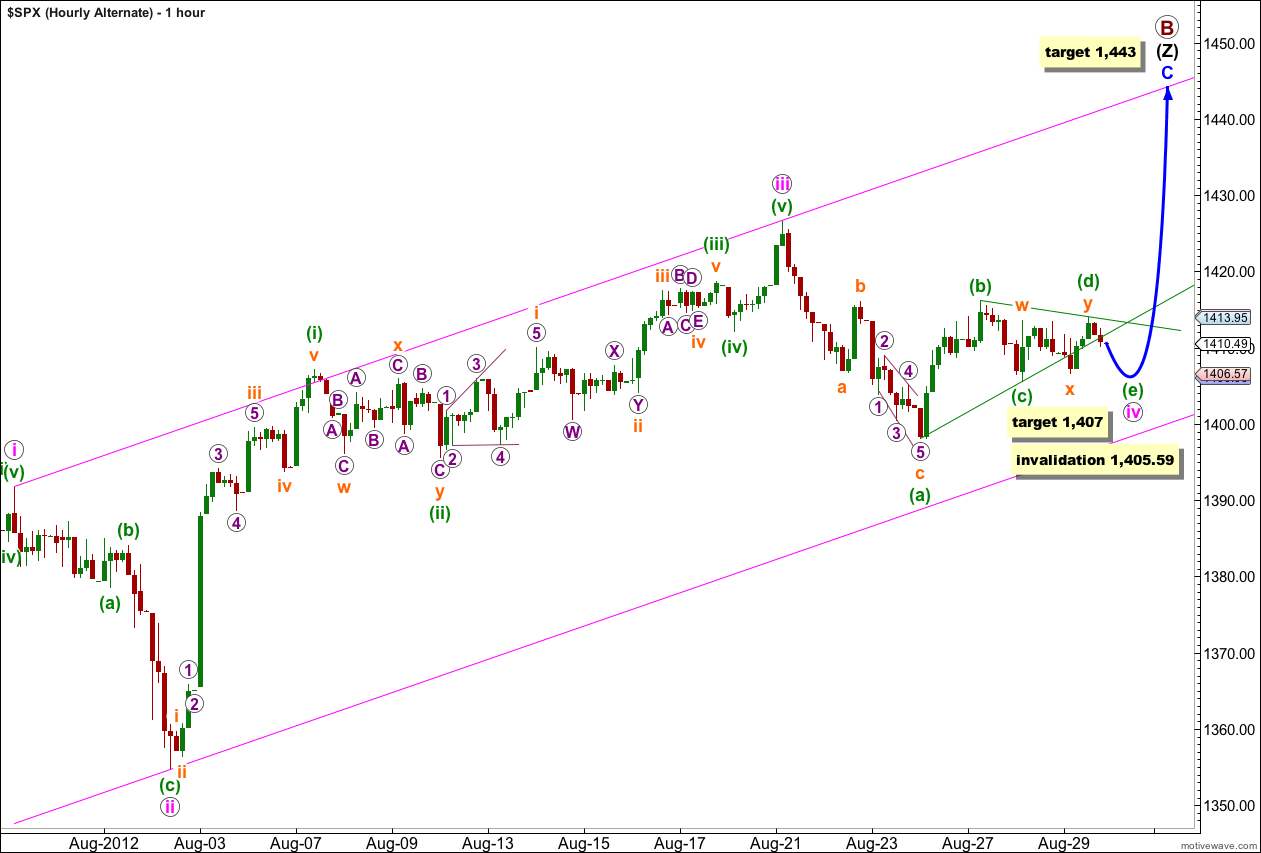
It is possible that wave iv pink is a contracting triangle.
Waves (a), (b) and (c) green of the triangle may all be seen as three wave structures on the 5 minute chart which fits this wave count.
Within wave (d) green double zigzag wave w orange subdivides best as a three, as does wave y orange.
However, wave x orange does not subdivide well into a single zigzag. It is more easily seen as a double zigzag which is not a correct possibility for an x wave (X waves should subdivide into a single three wave structure, not doubles or triples). This reduces the probability that this wave count is correct.
This wave count expects a little downwards movement to complete wave (e) green of the triangle tomorrow. At 1,407 wave (e) green would reach 80% the length of wave (d) green. Wave (e) green will overshoot the A-C trend line.
The point in time at which the triangle trend lines cross over may see a trend change.
Thereafter, it expects upwards movement most likely to a new high above 1,426.68.
Within the triangle wave (e) green may not move beyond the end of wave (c) green. This wave count is invalidated with movement below 1,405.59.
Second Alternate Hourly Wave Count.
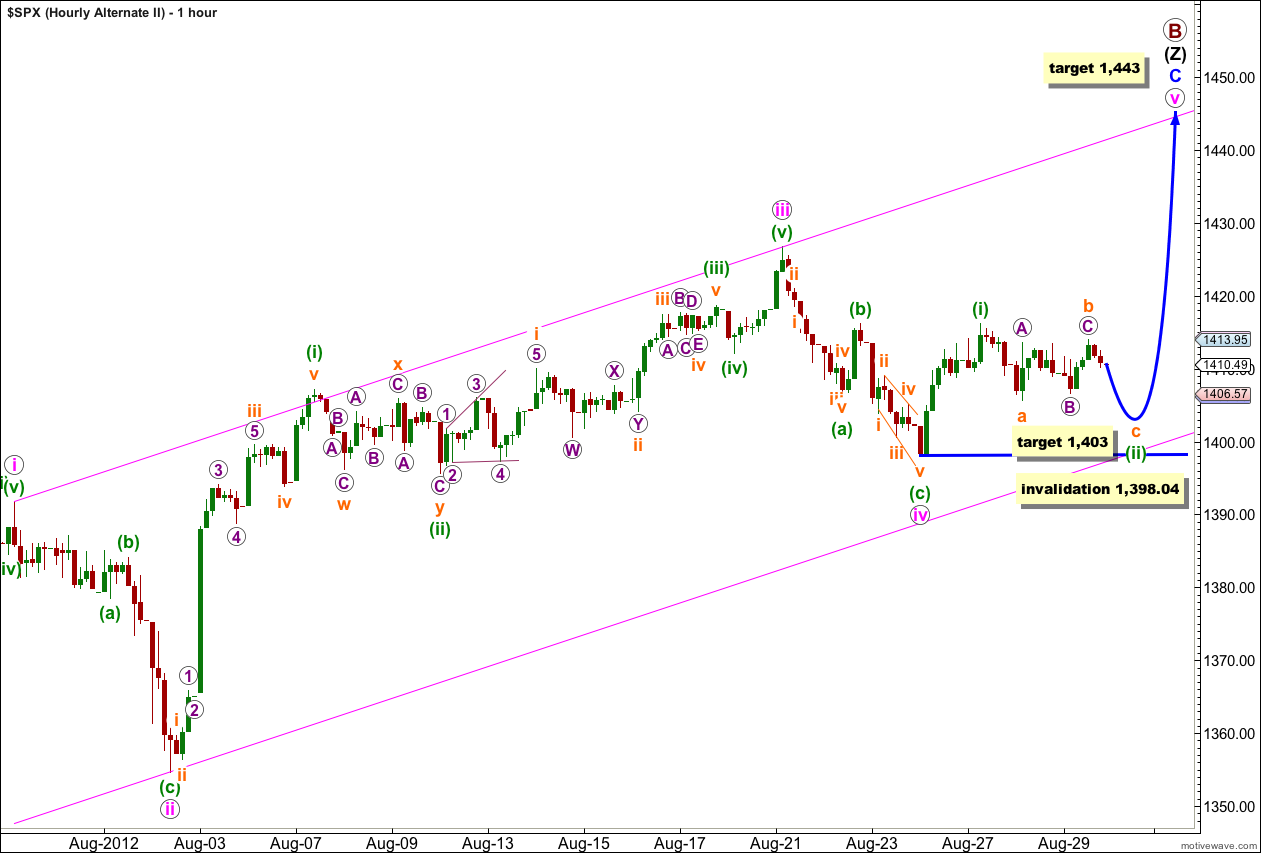
At this stage this wave count actually has a fairly good fit with its subdivisions as seen on the 5 minute chart.
Wave (i) green may be seen as a five wave impulse.
Wave (ii) green may be an incomplete flat correction. Wave b orange within it is a regular flat, with wave B purple a double zigzag. This all fits perfectly on the 5 minute chart.
Wave C purple within wave b orange is highly ambiguous. This wave count sees it as a five wave structure.
If this wave count is correct then downwards movement below the end of wave a orange at 1,405.59 would be highly likely for wave c orange to avoid a truncation.
Wave c orange must subdivide into a five wave structure. At 1,403 it would reach equality with wave a orange.
Wave (ii) green may not move beyond the start of wave (i) green. This wave count is invalidated with movement below 1,398.04.
Lara,
don’t worry about my last comment re zooming out time frames, I do see that you cover it in your historical analysis.
okay, great.
Lara, is it possible please to pull back and show the larger daily picture every so often so that we can remember what wave cycle we are in. For example your daily chart shows we are near to the end of primary wave B, but can we zoom out to see if this is a precursor to a first wave in a trend change etc…
Yes, it is possible. I’ll keep this in mind and try to fit it in without making the videos overly long.
You can always view the historical analysis to see the big picture, and I’ve been linking to it in the daily analysis.