
Yesterday’s analysis of the S&P 500 expected choppy, overlapping movement trending upwards for Wednesday’s session. Price has failed very slightly to make a new high so we did not see the upwards movement I was anticipating, but the sideways and overlapping movement is typical of a correction which was expected.
With more structure in this new movement to analyse I can now have a better idea of what should happen next.
I still have just the one daily wave count with two hourly wave counts today.
Click on the charts below to enlarge.
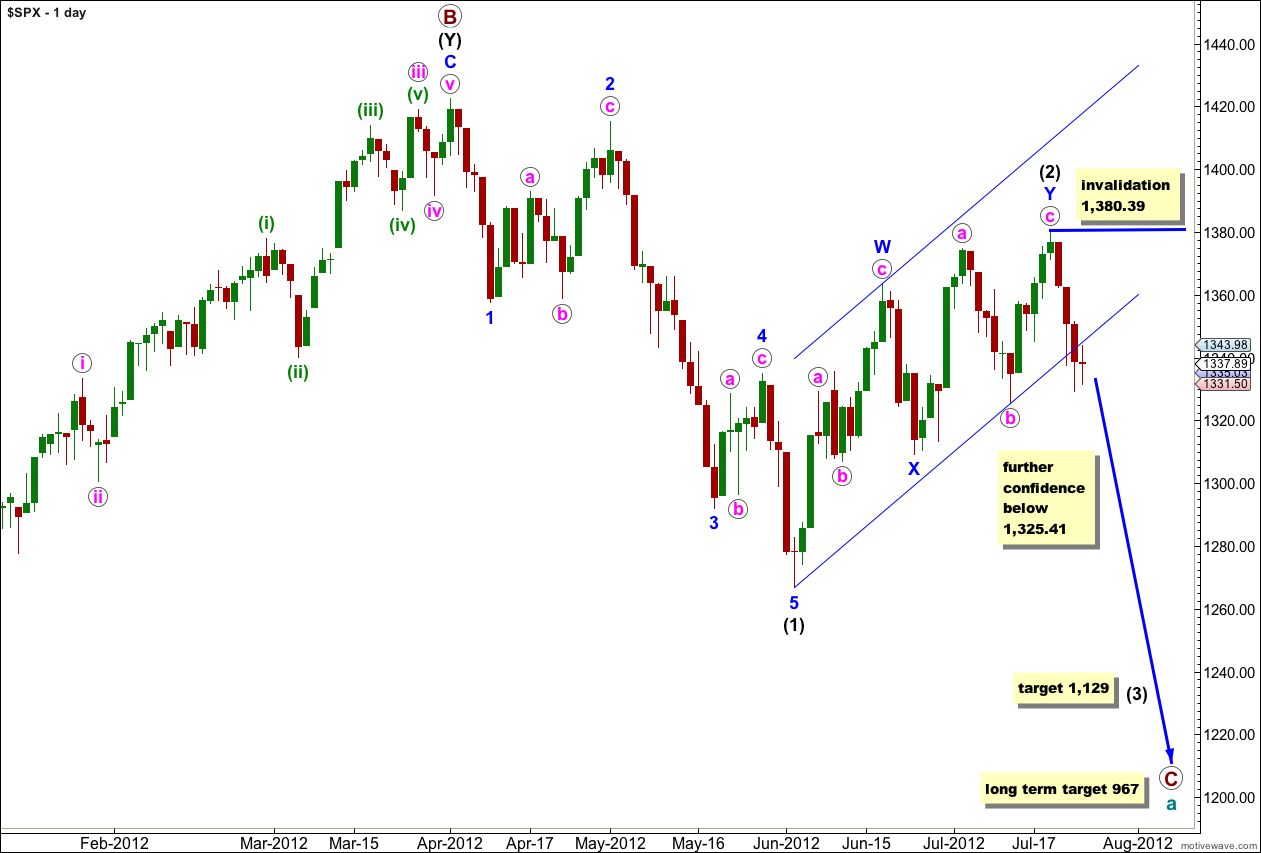
This wave count sees a big trend change at the price high of 1,422.38. Primary wave C should make substantial new lows below the end of primary wave A which had its low at 1,074.77. Primary wave C would reach 1.618 the length of primary wave A at 967, completing a typical expanded flat for cycle wave a.
Within primary wave C wave (1) black is a complete five wave impulse downwards. Wave (2) black now is most likely complete as a double zigzag structure.
The parallel channel about wave (2) black is a best fit to contain all this upwards movement. We now have a clear channel breach with a full daily candlestick below the channel. This gives some confirmation that (2) black should be over and (3) black should be underway.
The only way at this stage that wave (2) black could continue further would be as a very rare triple zigzag. The rarity of triples means the probability of wave (2) black continuing further is extremely low.
Movement below 1,325.41 would provide a lot more confidence in this wave count. At that stage wave c pink of Y blue could not possibly be continuing further and so the entire correction for wave (2) black would have to be over.
At 1,129 wave (3) black would reach 1.618 the length of wave (1) black.
Within wave (3) black no second wave correction may move beyond the start of its first wave. This wave count is invalidated with movement above 1,380.39.
Main Hourly Wave Count.
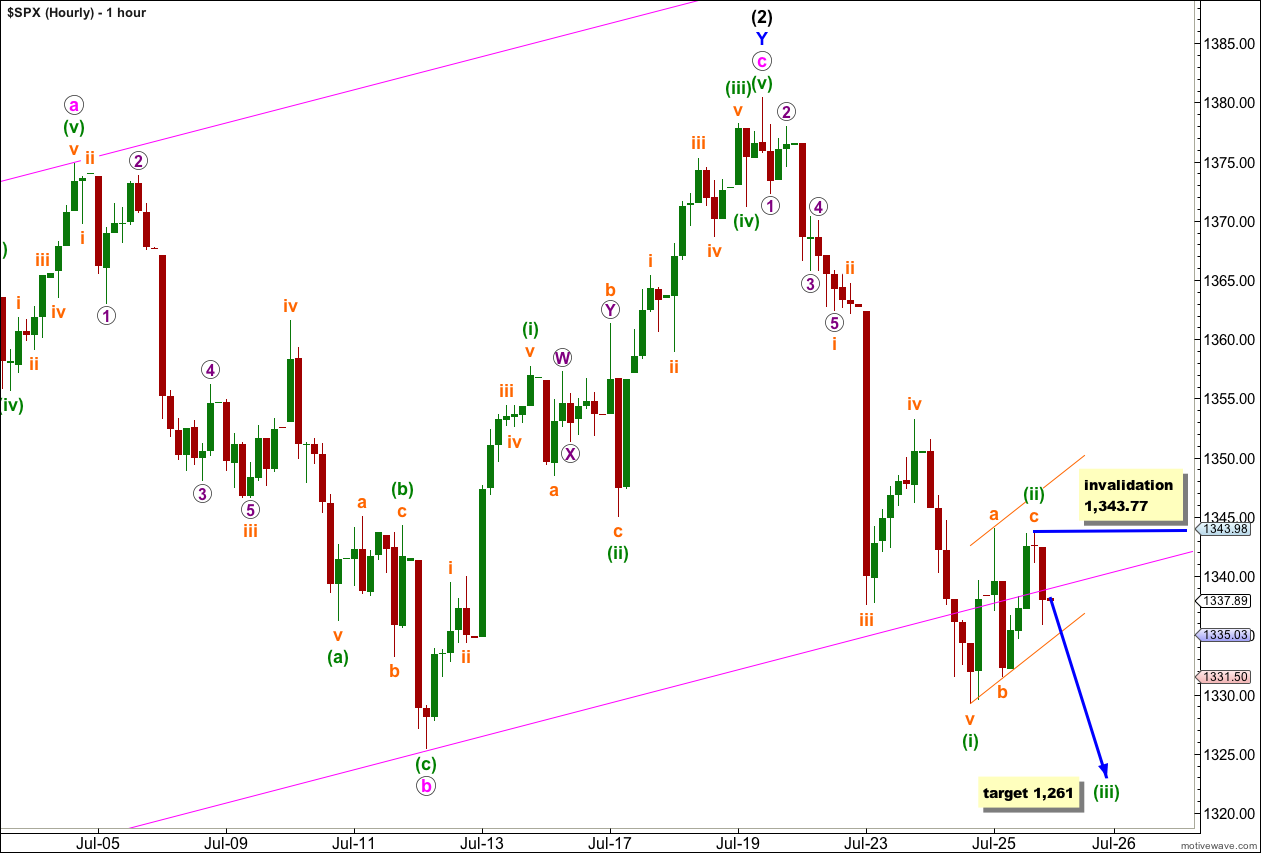
This main hourly wave count and the alternate below have about an even probability.
Wave (ii) green may have been over as a very shallow brief zigzag. There is no Fibonacci ratio between waves a and c orange. Wave c orange is very slightly truncated but all the subdivisions within it are correct and complete on the 5 and 1 minute charts. Wave (ii) green is a 28% correction of wave (i) green.
Price has found resistance at the lower edge of the parallel channel on the daily chart. This may have been the cause of the very slight truncation.
If this wave count is correct then tomorrow should see strong downwards movement as a third wave begins. At 1,261 wave (iii) green would reach 1.618 the length of wave (i) green.
This wave count would be confirmed with a clear 5 down on the 5 minute to hourly chart (I will be looking closely at the structure of the next session on all time frames). This would eliminate a possible B or X wave downwards and so eliminate the alternate below. Unfortunately, there is no lower price point which differentiates the two wave counts.
This wave count is invalidated by any movement above 1,343.77. Within wave (iii) green no second wave correction may move beyond the start of the first wave.
Alternate Hourly Wave Count.
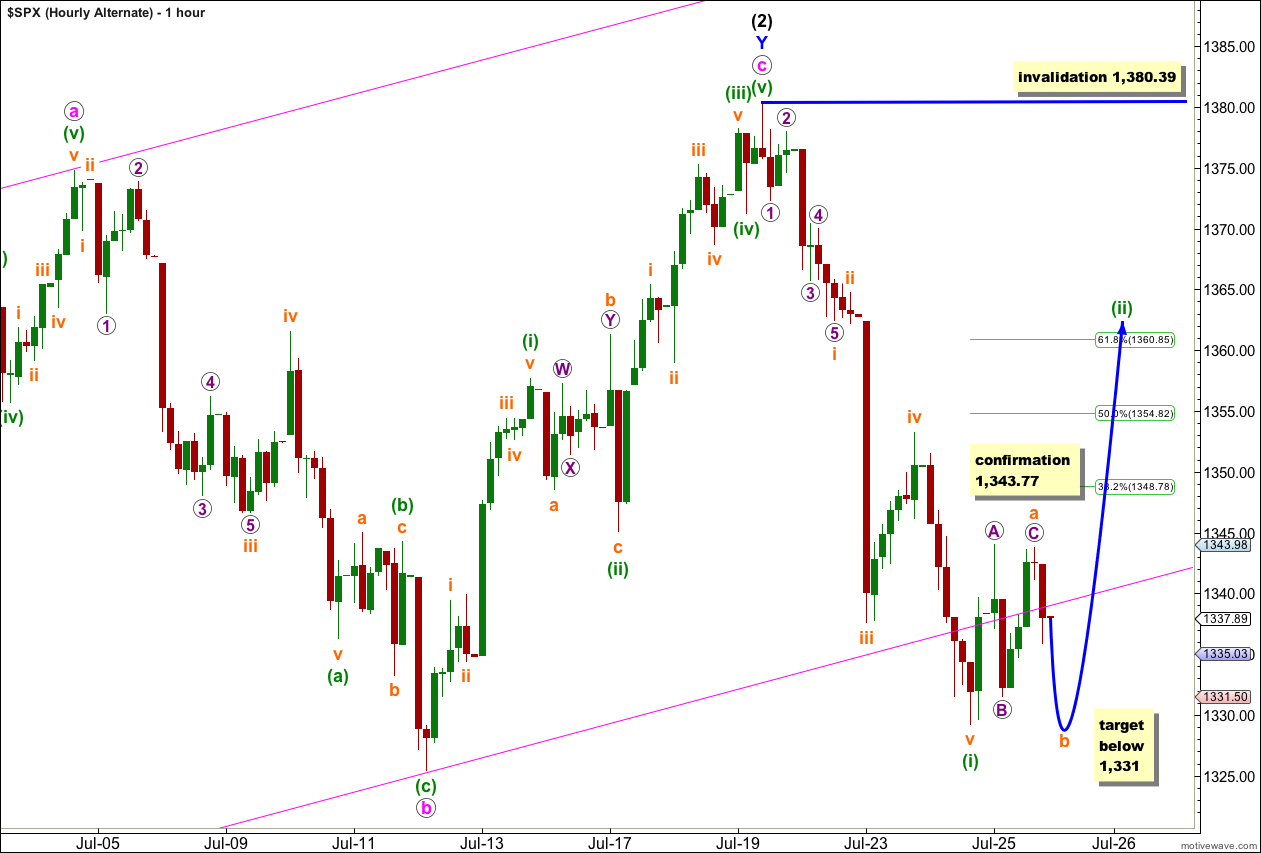
If we simply move the degree of labeling within this correction of wave (ii) green down one degree, we may have seen only wave a orange (or w orange) complete.
Wave (ii) green may be unfolding as a flat correction where wave a orange subdivides into a three. For a flat correction wave b orange should be at least 90% the length of wave a orange below 1,331. Within a flat correction wave B may make a new price extreme beyond the start of wave A so there is no downwards invalidation point and we could see a new low tomorrow.
Wave (ii) green may be unfolding as a double zigzag or double combination, where the first structure in the double is complete and would be labeled wave w orange (instead of wave a orange). A double would see a three down (most likely a zigzag) labeled wave x orange. This would not have to be at least 90% the length of wave a orange and if downwards movement falls short of 1,331 tomorrow then this would be a likely explanation.
When wave b orange (or wave x orange) is complete we should see further upwards movement for wave c orange (or sideways movement for wave y orange) to complete the entire correction for wave (ii) green.
This alternate wave count expects overall choppy overlapping movement for tomorrow: beginning with downwards movement possibly to new lows, and thereafter upwards movement possibly to new highs.
Wave (ii) green may not move beyond the start of wave (i) green. This wave count is invalidated with movement above 1,380.39.
Truncation Wave (often after an unusually strong wave 3 thrust.) 15min looks like a head and shoulders top now. ES HOD 1357
Lara,
I’m wondering if what you have labeled as orange c of green ii was actually just wave 1 of orange c. Yesterday’s move down at the close could have been wave 2, with a wave 3 up this morning.
Peter
Yes, that will be my wave count exactly today.
Sold the 61.8% Fib … ES HOD 1354.50 ….
Hope this works.. 🙂