
Exactly as expected Tuesday’s session saw the S&P 500 move lower. The short term target was 1,328. Price fell just 1.24 points short of this target to reach 1,329.24 before turning upwards.
I have still just the one daily and one hourly chart today. I will be using the parallel channel on the daily chart as an important indicator of a trend change.
Click on the charts below to enlarge.
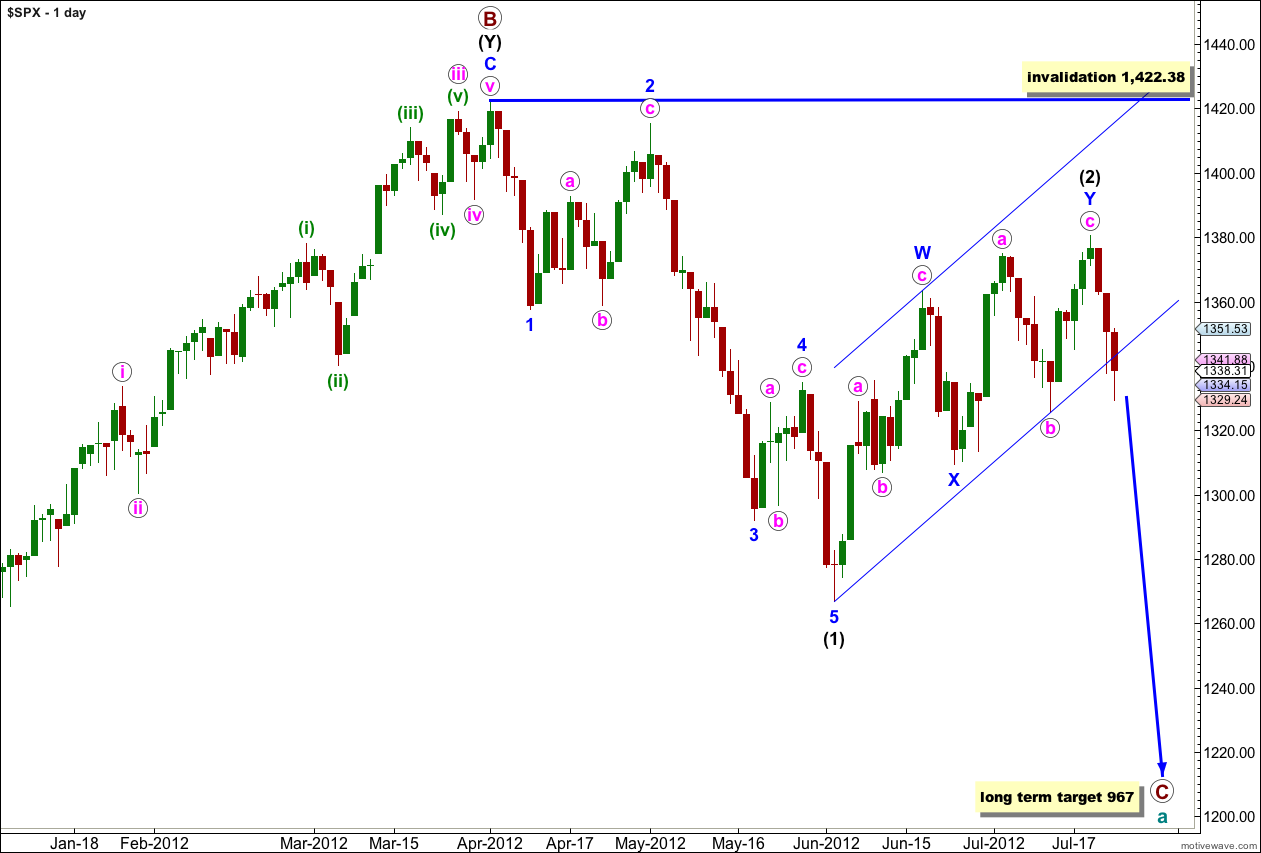
This wave count sees a big trend change at the price high of 1,422.38. Primary wave C should make substantial new lows below the end of primary wave A which had its low at 1,074.77. Primary wave C would reach 1.618 the length of primary wave A at 967, completing a typical expanded flat for cycle wave a.
Within primary wave C wave (1) black is a complete five wave impulse downwards. Wave (2) black is unfolding as a double zigzag structure. The purpose of a double zigzag is to deepen a correction. At this stage the final structure of wave Y blue, the second zigzag, may now be complete. However, we do not have confirmation of this trend change. Until we do have confirmation it is very important to accept the possibility that we may yet see further upwards movement.
The parallel channel about wave (2) black is a best fit to contain all this upwards movement. When we have a clear channel breach with a full daily candlestick below the channel then we may have confirmation that (2) black would be over and (3) black would be underway.
Wave (2) black may not move beyond the start of wave (1) black. This wave count is invalidated with movement above 1,422.38.
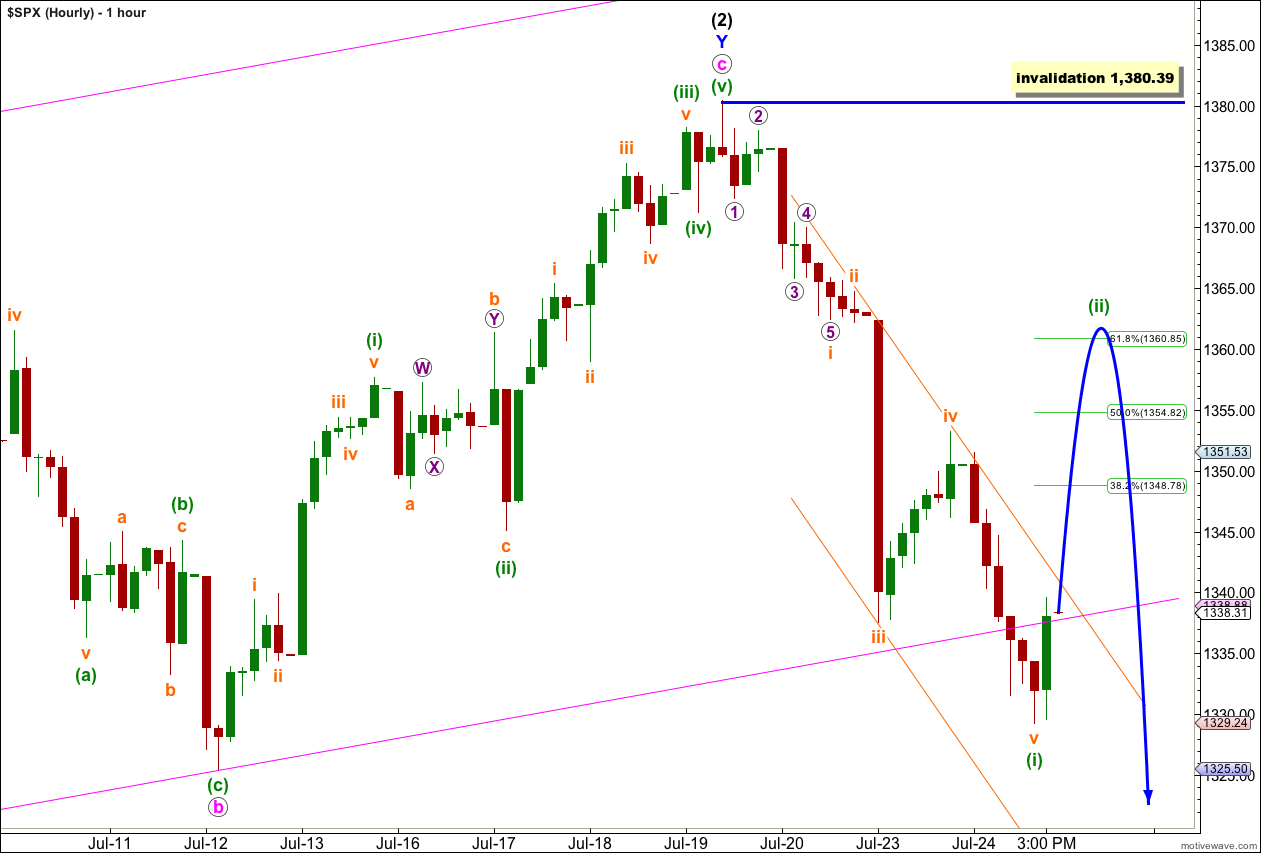
We now have a fairly clear five down on the hourly chart. This should be followed by a second wave correction labeled (ii) green.
Ratios within wave (i) green are: wave iii orange is 2.02 points short of 1.618 the length of wave i orange, and wave v orange has no adequate Fibonacci ratio to either of waves i or iii orange.
Second wave corrections are normally deep rather than shallow so I favour the 0.618 Fibonacci ratio of wave (i) green at 1,360.85 as a target. Wave (ii) green may unfold as a simple zigzag which may see it over in one or two sessions. This may take price back into the parallel channel on the daily chart.
If the parallel channel on the daily chart provides resistance to upwards movement it may hold the correction to a more shallow target about the 0.382 Fibonacci ratio of wave (i) green at 1,348.78. A more shallow correction may unfold as a flat or a combination and may be more time consuming, possibly lasting three or four sessions.
At this very early stage it is not possible to say what structure will unfold or how long it will take, only to say that it would be more likely to be a brief sharp zigzag.
I have used Elliott’s second technique to draw a parallel channel around wave (i) green downwards. Draw the first trend line from the highs of waves ii and iv orange, then place a parallel copy upon the low of wave iii orange. Wave (ii) green should breach the upper edge of this channel which would confirm an end to wave (i) green downwards and the start of wave (ii) green upwards.
When wave (ii) green is over we may expect an increase in downwards momentum as a third wave unfolds.
Wave (ii) green may not move beyond the start of wave (i) green. This wave count is invalidated with movement above 1,380.39.
Thank You Lara!
John
Apple Inc. Big Miss… ES drops to 1321.25 could you see one more wave down into 1326 which could be the end of an A Wave too?
certainly.
if (ii) green is a flat correction then it may make a new low for wave b orange within it.
that is why there is no lower invalidation point on the hourly chart.
however, even if it does make a new low (or get close to it) it would be only for a b wave and so the movement would be choppy and overlapping