
Tuesday’s session saw upwards movement from the S&P 500 which was what Monday’s analysis expected.
Movement above 1,357.38 has invalidated the main daily wave count and confirmed the alternate leaving us with only one daily wave count for downwards movement.
Click on the charts below to enlarge.
Main Wave Count.
I have adjusted the wave count to something which combines the ideas of both previous wave counts, and has a better fit and a really good overall look.
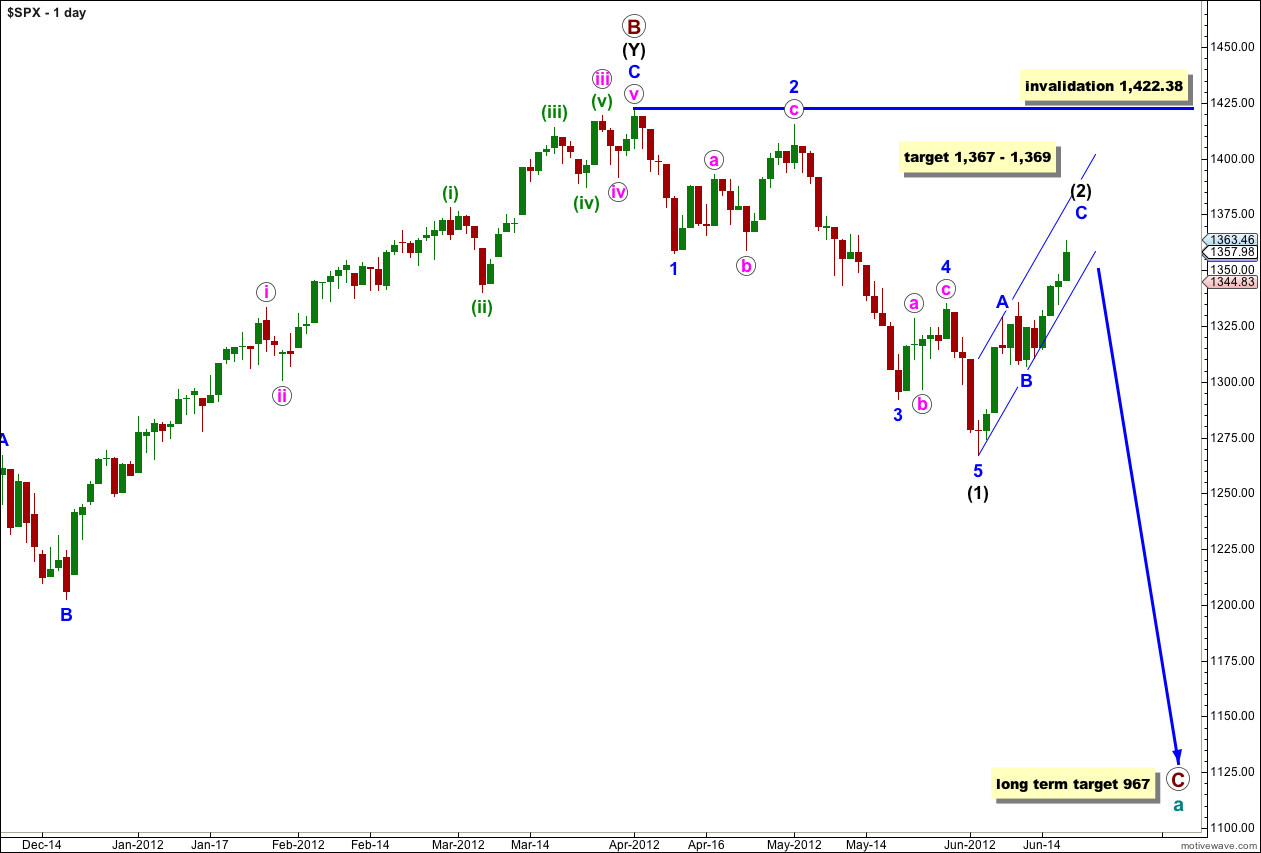
On the monthly chart, looking at where I expect primary wave C to end up, it makes sense that intermediate (black) wave 1 could be over lasting 43 sessions, 2 monthly candlesticks. This is acceptable for an intermediate degree wave and first waves are often relatively brief.
Minor degree waves (blue labeling) are lasting from 1 to 3 weeks which is the expected duration for this degree.
If the next wave down (no matter what degree of labeling it would still be a third wave) is relatively short and brief then I would consider moving everything from the start of primary wave C down one degree. I will leave it as is for now.
Ratios within black wave (1) are: wave 3 blue has no Fibonacci ratio to wave 1 blue, and wave 5 blue is 3.19 points longer than equality with wave 1 blue.
There is nice alternation between waves 2 and 4 blue: wave 2 blue is a deep flat correction and wave 4 blue is a relatively shallow zigzag.
Within wave (2) black so far there is no Fibonacci ratio between waves A and C blue. If wave C blue moved just over 5 points higher to end at 1,369 then they would reach equality. At this stage on the hourly and 5 minute chart I cannot say for sure that upwards movement is over, and if tomorrow saw a little more upwards movement then ratios would be better.
Wave (2) black may not move beyond the start of wave (1) black. This wave count is invalidated with movement above 1,422.38.
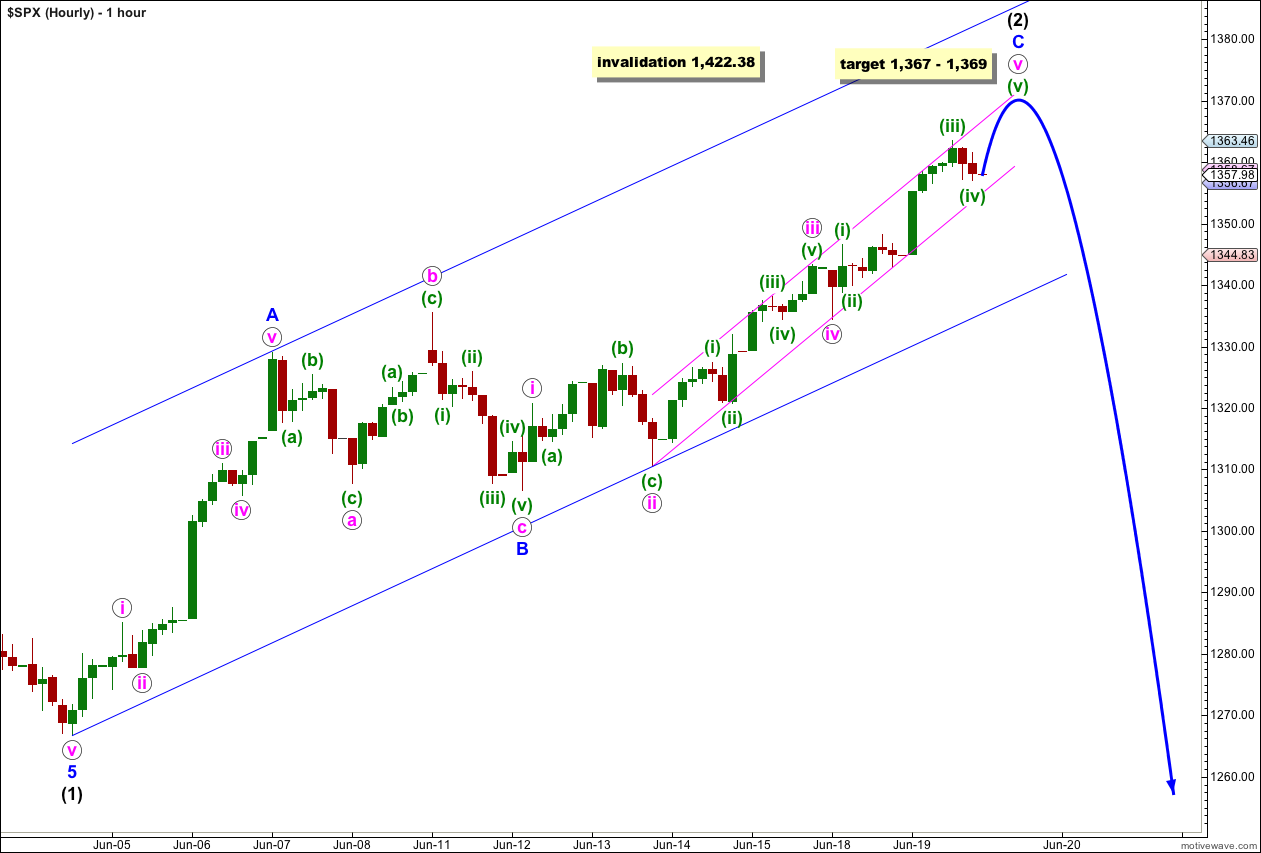
At this stage the zigzag labeled wave (2) black is probably close to completion. I want to see the parallel channel around it breached by downwards movement before I am confident upwards movement is over. At that stage I would calculate targets for wave (3) black downwards. To do so prior to trend channel confirmation would be premature.
The other variable is whether or not wave (2) black will be a single zigzag structure or may continue further as a double. The alternate looks at this possibility.
Primary wave C would reach 1.618 the length of primary wave A at 967, completing a typical expanded flat for cycle wave a.
On the 5 minute chart it looks like the final fifth wave labeled here (v) green could be incomplete. Downwards movement to end Tuesday’s session is so far in a three wave movement indicating that we have not yet seen a trend change to the downside.
Within wave C blue there is no Fibonacci ratio between waves i and iii pink. This makes it more than likely that we shall see a Fibonacci ratio between wave v pink and either of i or iii pink. At 1,367 wave v pink would reach equality with wave iii pink. This gives us a small 2 point target zone with a reasonably good probability.
We should keep drawing a parallel channel about this upwards zigzag. This channel needs to be breached by downwards movement before we can confirm a trend change. For this main wave count we also need to see downwards movement unfolding as a clear five wave structure to indicate that it is wave (3) black and to eliminate the alternate wave count below.
Alternate Wave Count.
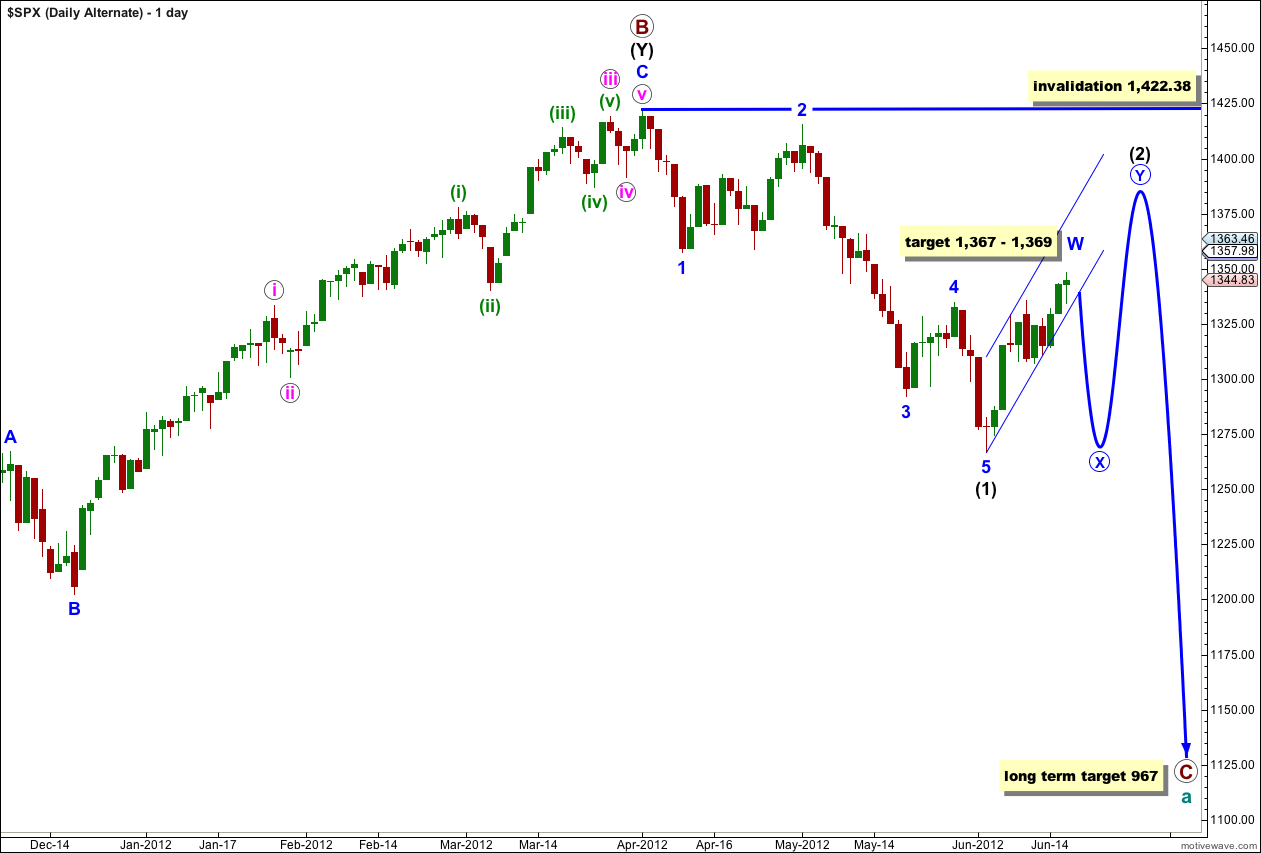
This alternate wave count is identical to the main wave count with the sole exception of looking at wave (2) black as a double rather than a single.
If this wave count is correct then when the first zigzag is over the next movement would be downwards in a three wave structure for an X wave. This is most likely to be a zigzag.
Wave X blue may make a new low below the start of wave W blue, but it is unlikely to. There can be no downwards invalidation point for this reason. We will have to pay close attention to structure to indicate which of our two wave counts is correct.
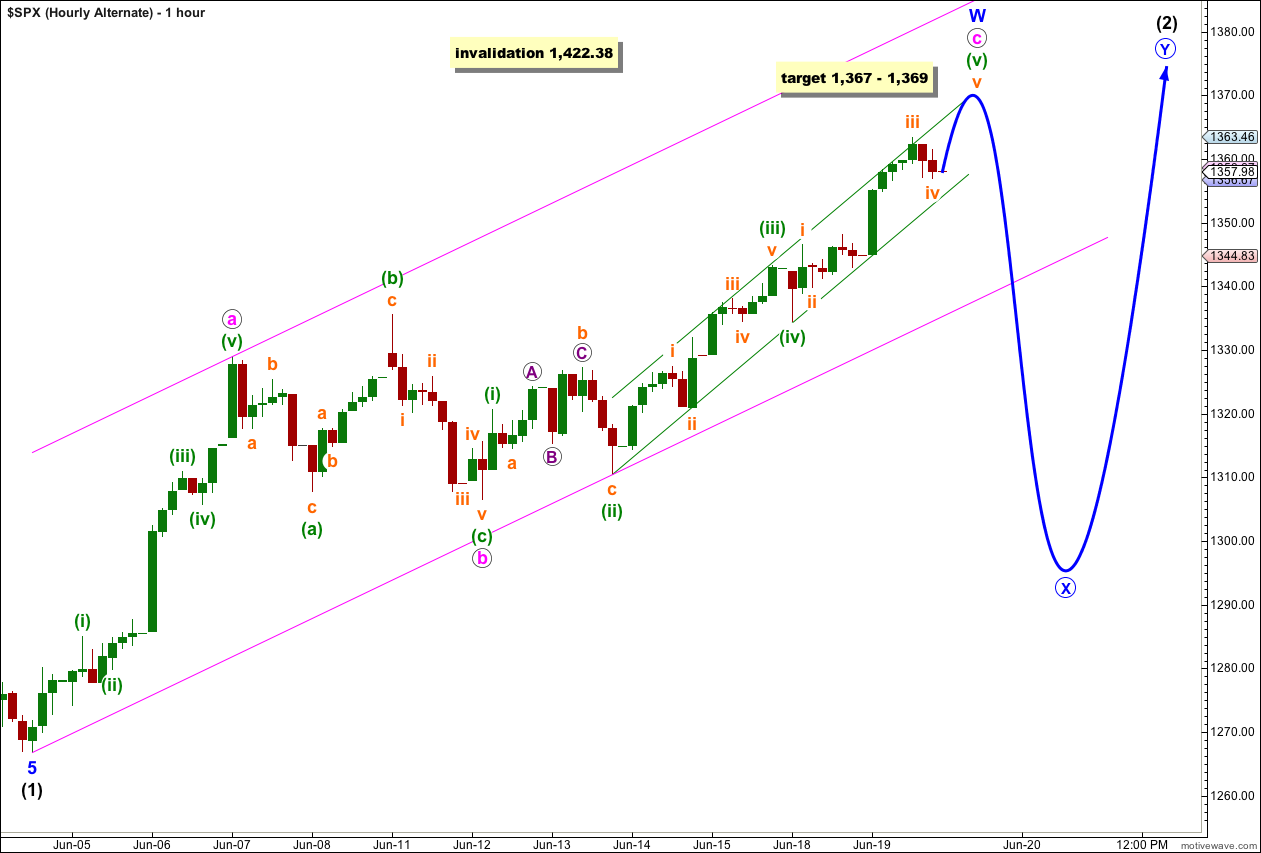
This hourly chart is identical to the main hourly chart except everything within wave (2) black is moved down one degree as it looks at wave (2) black as a possible double.
Targets and invalidation points are the same for the same reasons.
Truncated 5th Wave … looks like we are on our way to the X Wave area?