
Last analysis expected a very little downwards movement before upwards movement for Monday’s session towards a short term target at 1,345. The S&P 500 has behaved as expected, but overshooting the target by 3.22 points to reach 1,348.22.
Today I have two daily charts and two hourly charts for you.
Click on the charts below to enlarge.
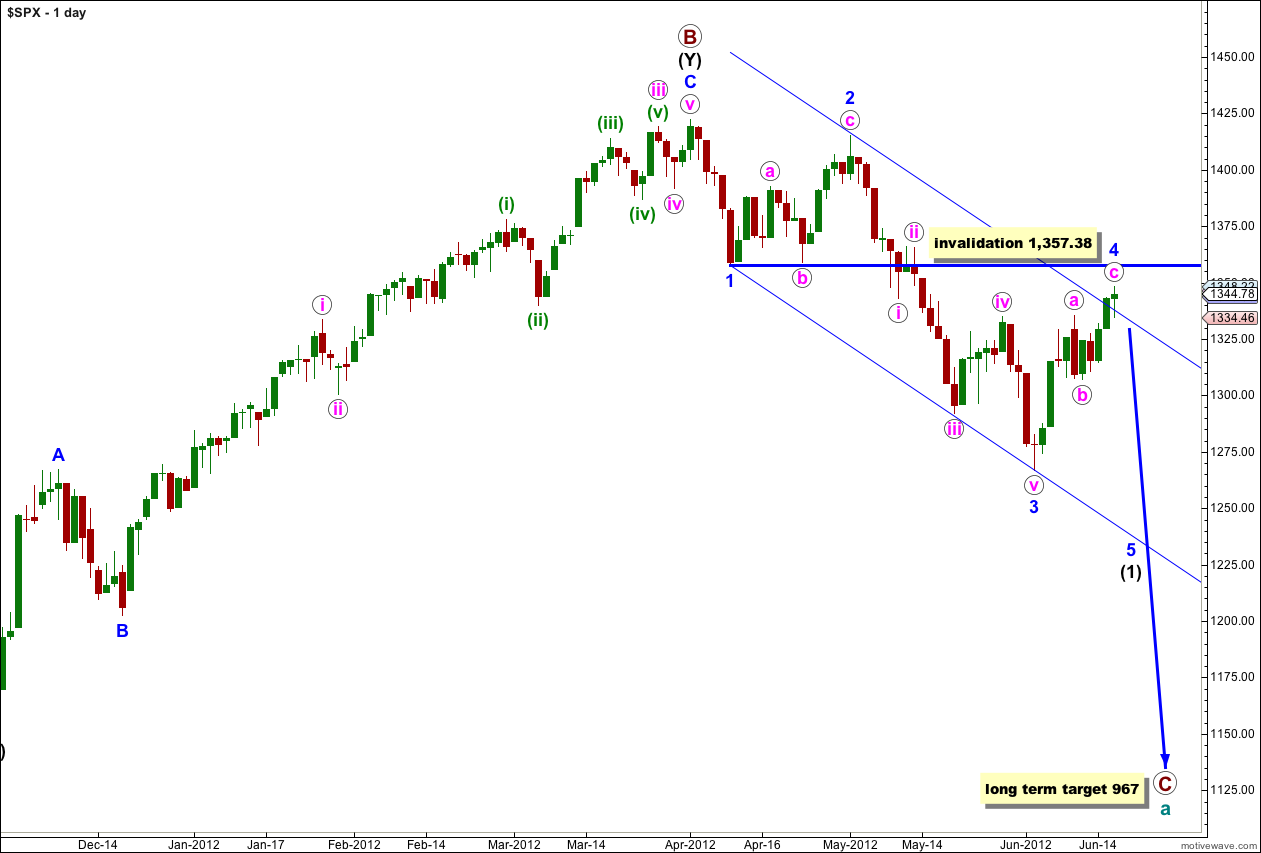
We have recently seen a very large trend change on the S&P 500 and a new downwards trend, to last months, has begun.
At cycle degree wave a (teal green) is an expanded flat correction. Primary wave A (maroon) within it subdivides into a three, and primary wave B is over 105% of primary wave A at 123%. The minimum requirements for an expanded flat are met. We should expect primary wave C to subdivide into a five and move price substantially below the end of primary wave A at 1,074.77.
At 967 primary wave C would reach 1.618 the length of primary wave A. If price continues through this first target, or it gets there and the structure is incomplete, then our second (less likely) target is at 685 where primary wave C would reach 2.618 the length of primary wave A.
Primary wave A lasted 4 months. Primary wave B lasted 6 months. We may expect primary wave C to last at least 4 months, if not longer.
Wave 4 blue may not move into price territory of wave 1 blue. This wave count is invalidated with movement above 1,357.38. At this stage we have (almost) a completed zigzag within wave 4 blue. We must consider the alternate possibility that wave 4 blue may continue further as a double, and that this zigzag is only the first of two corrective structures. The alternate hourly wave count below looks at this possibility.
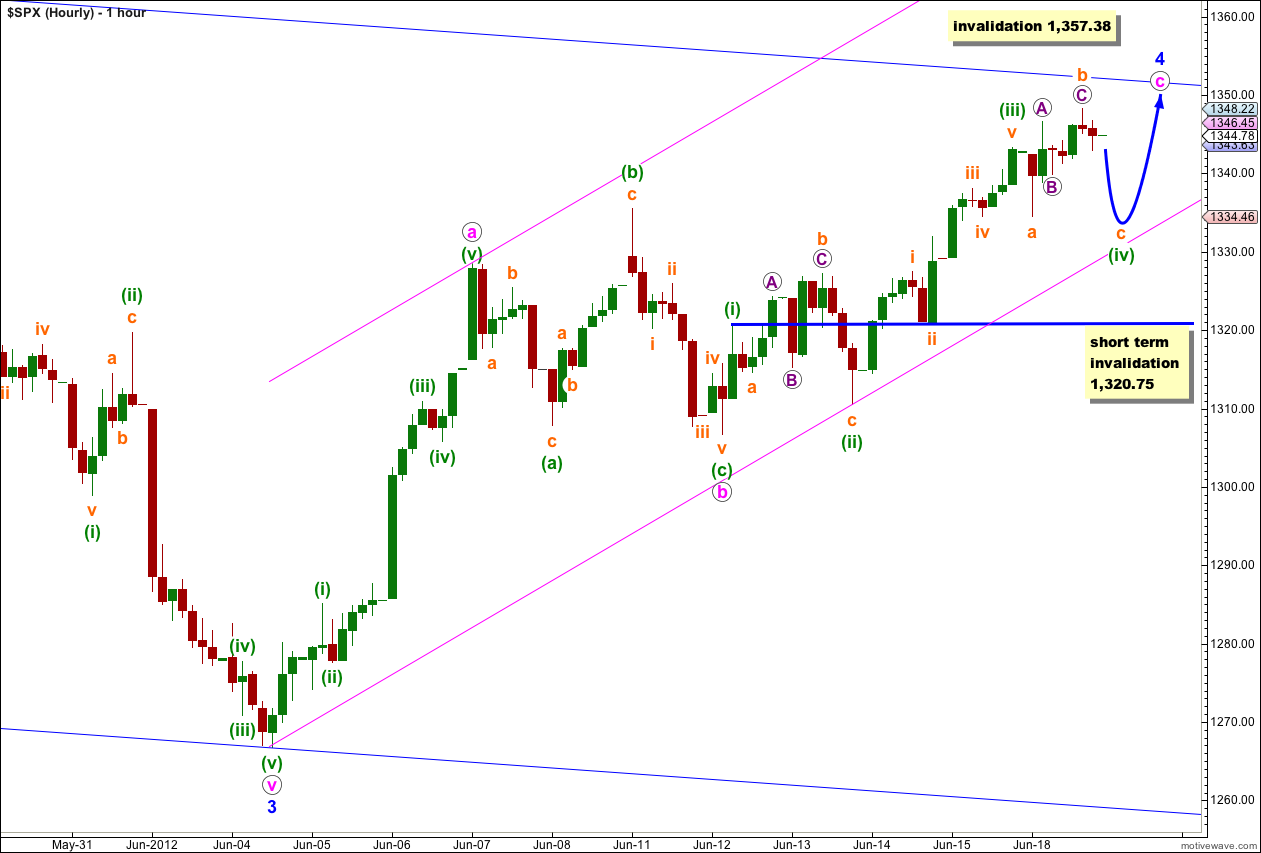
Wave 4 blue is very close to completion. Within wave c pink wave (iv) green is most probably incomplete. It may complete as a flat or as a double.
I have considered several possibilities and I am publishing only the most likely with the best fit. It looks like wave (iv) green is an incomplete flat or double. Wave c orange (or wave y orange if it is a double) is likely to make a slight new low below the end of a (or w) orange below 1,334.46. When that is done then we should expect again upwards movement for wave (v) green which should find resistance at the upper edge of the parallel channel.
Wave (iv) green may not move into wave (i) green price territory. Movement below 1,320.75 would invalidate this hourly wave count and indicate strongly that the zigzag of wave 4 blue is complete.
There is another possibility that wave (iv) green was a brief zigzag and complete at the low labeled a orange within (iv) green. If that is the case then tomorrow we would expect overall upwards movement to new highs as wave (v) green completes, and on the 5 minute chart it looks like its third wave is extending.
1,320.75 may be used as an indicator of this zigzag being over. When price moves below this point then the five wave structure for wave c pink must be over.
Alternate Daily Wave Count.
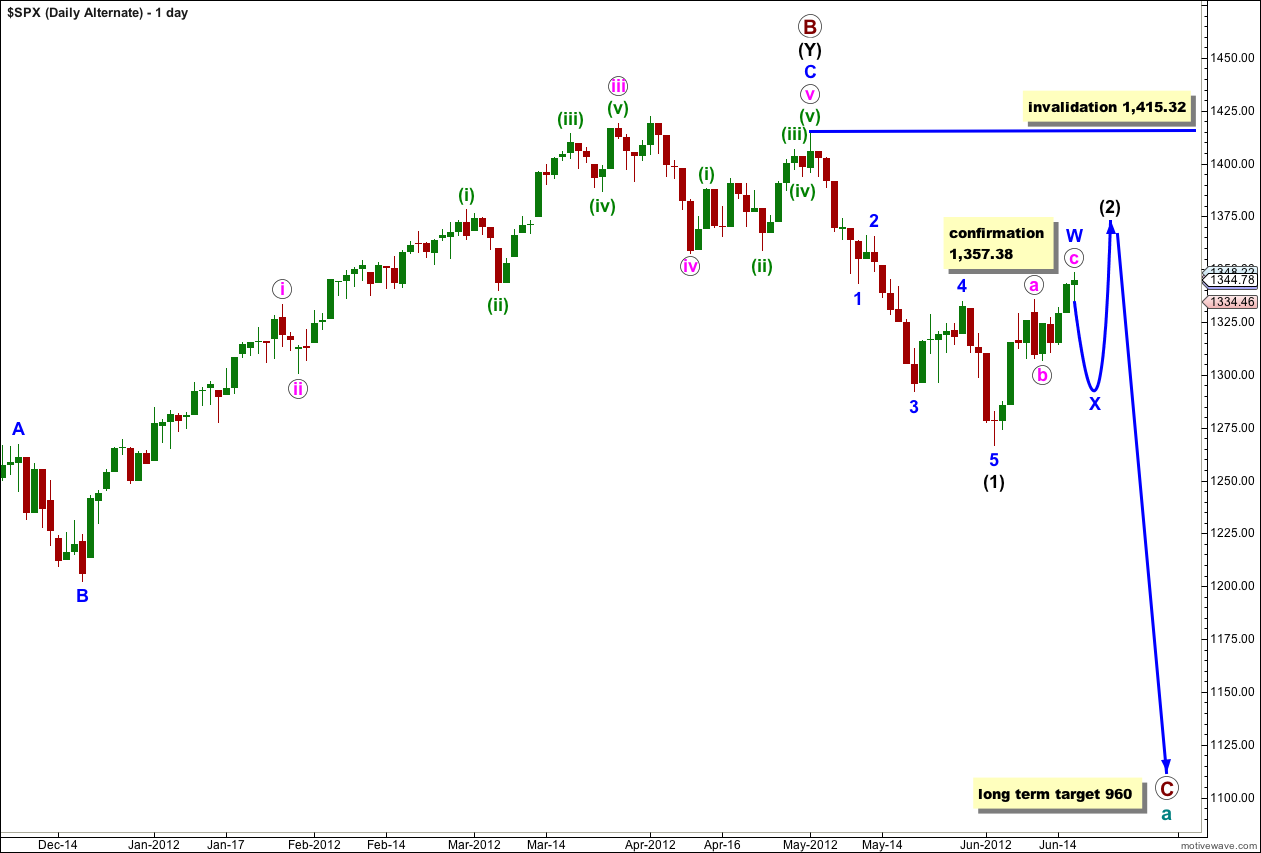
Primary wave B may have ended at 1,415.32 with a fifth wave truncation. The truncation reduces the probability of this alternate.
Wave (1) black is complete. This alternate now expects a second wave correction for wave (2) black. Wave (2) black can move right up to, but not above, 1,415.32.
This wave count diverges from our main wave count. The price point which differentiates the two is 1,357.38. The main wave count would not allow movement above that price point and this alternate sees it as reasonably likely. If price did move above 1,357.38 the main wave count would be invalidated and this alternate would be our sole wave count.
This alternate wave count expects a more long lasting and deeper correction than our main wave count. If this alternate is correct then intermediate wave (2) may last at least 4 weeks and possibly longer. For this reason it looks likely at this stage that wave (2) black would be unfolding as a double zigzag or double combination correction, with the first zigzag almost complete.
Wave (2) black may not move beyond the start of wave (1) black. This wave count is invalidated with movement above 1,415.32.
Alternate Hourly Wave Count.
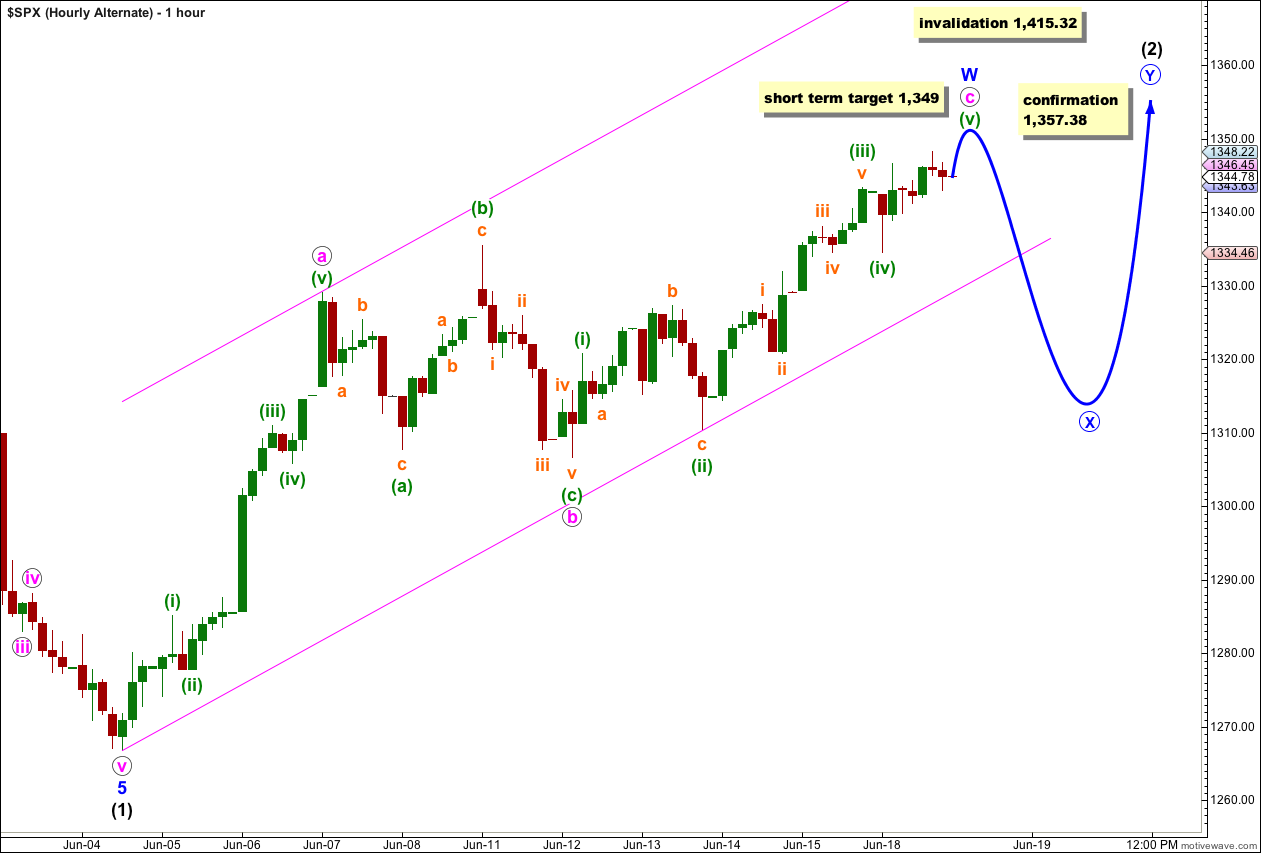
If we move everything within the upwards zigzag down one degree we may only be seeing the first structure of a double complete.
On this hourly chart I am showing also the alternate idea that within wave C of the first zigzag (here labeled wave c pink of W blue) that its fourth wave labeled here (iv) green is complete and the fifth wave of (v) green is unfolding. At 1,349 wave (v) green would reach equality with wave (i) green.
This alternate hourly chart expects a little more upwards movement overall to complete wave c pink of the first structure, a zigzag labeled W blue.
Thereafter, this alternate expects a three wave structure downwards for an X wave to join the two structures of the double.
We will have to look carefully at downwards movement following the completion of the zigzag. If it is a three then this alternate will be possible. If it is a five then our main wave count will have a better fit.
The current target for the VIX is 12.13 with the head and shoulders and the IHS on the SPX would put us into the 1403 area.
so, did you expect wave 5 green to be exactly 1345? or just close and lower?
probably higher actually, I think that target is a bit conservative (too low)
Good afternoon Lara,
Any targets for
1. wave 4 blue in your first count
and
2. wave X circle in your alternate count?
Thanks.
1. no target for 4 blue at this stage because c is already over 0.618 X a pink, so I have to use green degree. I don’t know where green (iv) ends so I cannot calculate a target for green (v) yet, maybe after one more session I can.
2. nope. not until a and b within it are done can we calculate a target. it’s most likely to be a simple zigzag and it’s most likely to not make a new low, although technically it can.