
I currently have three monthly charts for the Dow.
The main monthly wave count is the wave count I follow with daily analysis. It sees the Dow as within the second structure of a double flat or double combination at super cycle degree.
The first alternate wave count looks at a very rare expanding triangle at super cycle degree. The rarity of this structure significantly reduces the probability of this alternate wave count.
The second alternate wave count has a very low probability because it has to see what looks clearly like a three as a five. Only with a new all time high could I really take this alternate wave count seriously.
Click on the charts below to enlarge.
Main Wave Count.
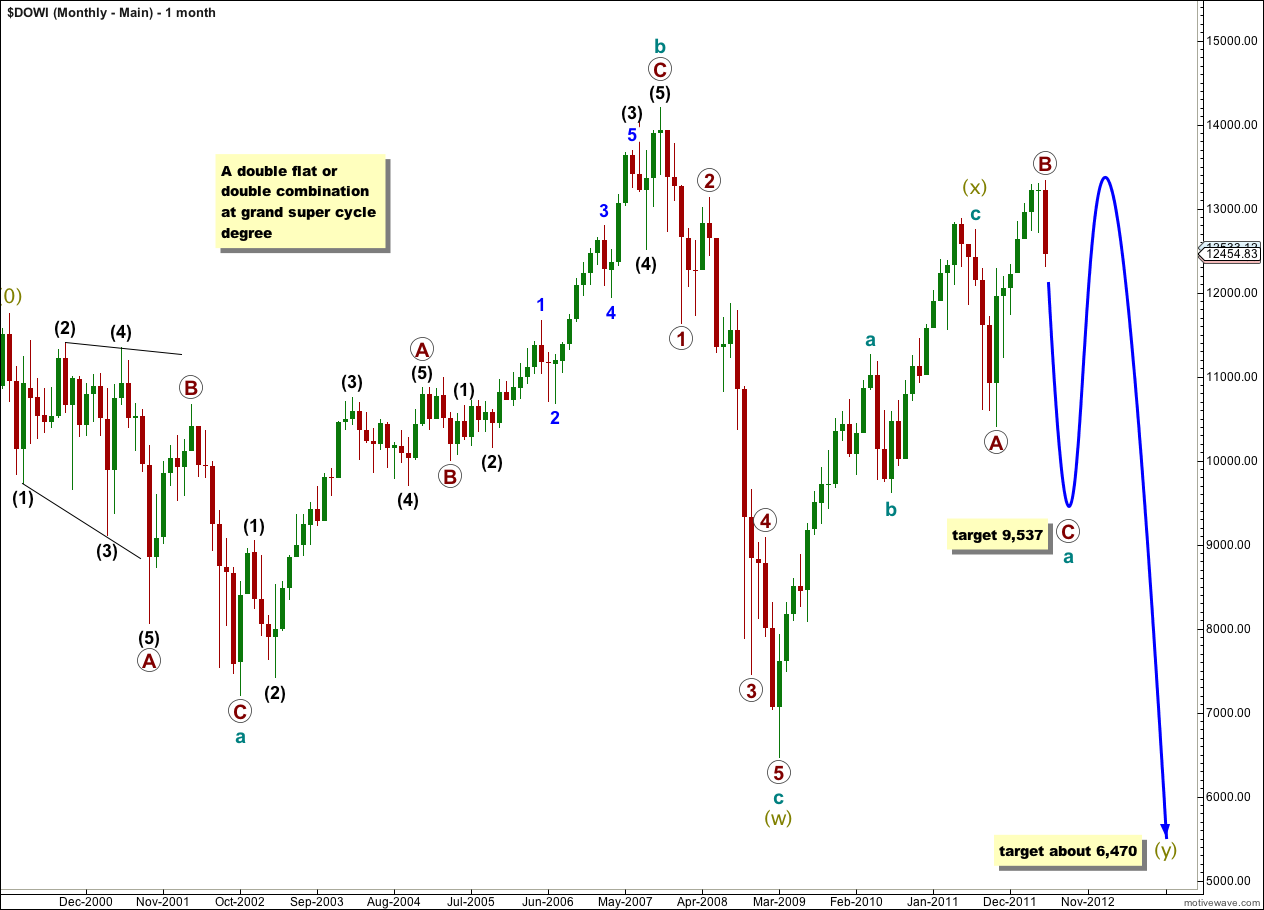
This wave count has the highest probability.
It looks at the possibility that the Dow is within a very large double flat or double combination correction at grand super cycle degree.
The first structure in the double is an expanded flat correction at super cycle degree labeled (w) olive green. Within wave super cycle wave (w) cycle wave b (teal green) is a 154% correction of cycle wave a, and cycle wave c has no Fibonacci ratio to cycle wave a.
The double is joined by a three in the opposite direction labeled super cycle (x).
The second structure in the double has begun, labeled super cycle wave (y). Super cycle wave (y) may be either a flat correction or a triangle.
Within super cycle wave (y) cycle wave a is subdividing into a three, an expanded flat correction. Primary wave A within it was a three, primary wave B was a three and was 119% of cycle wave a. At 9,537 primary wave C would reach 1.618 the length of primary wave A. This is our long term target for cycle wave a to end.
When cycle wave a has ended then cycle wave b upwards must reach at least 90% the length of cycle wave a; at that stage this wave count expects another long lasting upwards trend which must subdivide into a three, and may also make a new high above the start of cycle wave a at 12,627.23.
There is no downwards invalidation point for this wave count; it may make new lows. There is no upwards invalidation point either; cycle wave b may move beyond the start of cycle wave a, and in fact would be very likely to do so. Because of the lack of invalidation points for this wave count I will pay careful attention to the subdivisions being correct, and at this stage all the subdivisions fit neatly which is why it is my main wave count.
First Alternate Wave Count.
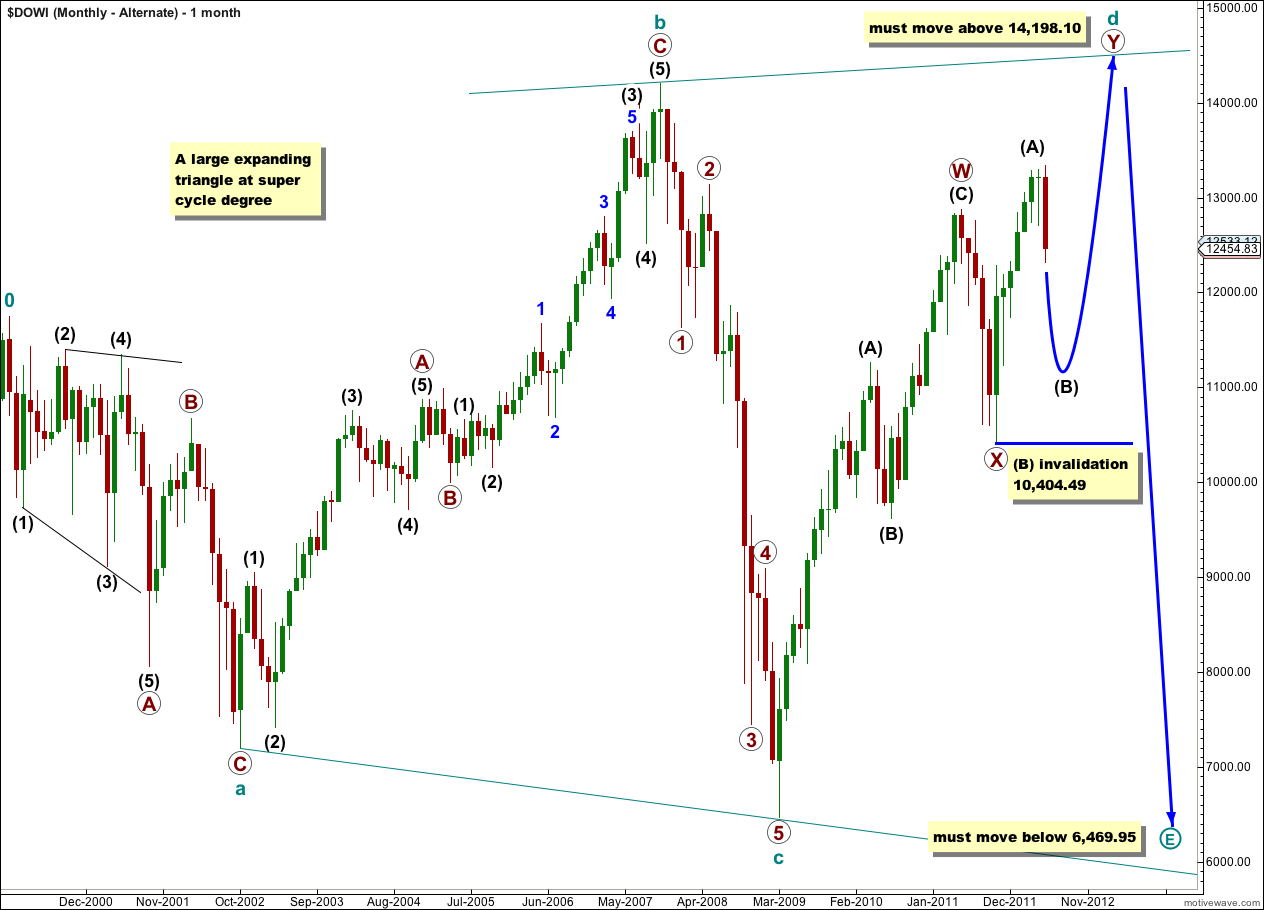
This first alternate wave count looks at the unlikely possibility that there is a very large expanding triangle unfolding on the Dow at super cycle degree. Because expanding triangles are rare structures this wave count has a low probability.
Four of the five subwaves of a triangle must be zigzags or zigzag combinations (doubles). Thus cycle wave c may be an impulse. However, with the downwards wave labeled cycle wave c looking most like a five wave impulse the structure from the start of the correction at 0 to that point looks very much like a flat correction, this again reduces the probability of this alternate wave count a little further.
Within a triangle one of the five subwaves should be more complicated and longer lasting than the others. This is usually wave c of the triangle, but in this instance it may be cycle wave d which is subdividing into a double zigzag.
Within cycle wave d the first zigzag in the double, primary wave W, is complete. The double is joined by a three in the opposite direction labeled primary wave X. The second zigzag in the double is underway labeled primary wave Y.
An expanding triangle requires cycle wave d to move beyond the end of cycle wave b above 14,198.10.
Within primary wave Y intermediate (black) wave (A) must be seen as a five wave structure. This is possible, but it does not have the right look. This further reduces the probability of this wave count.
Within primary wave Y zigzag intermediate wave (B) may not move beyond the start of intermediate wave (A). This wave count is invalidated in the mid term with movement below 10,404.49.
Second Alternate Wave Count.
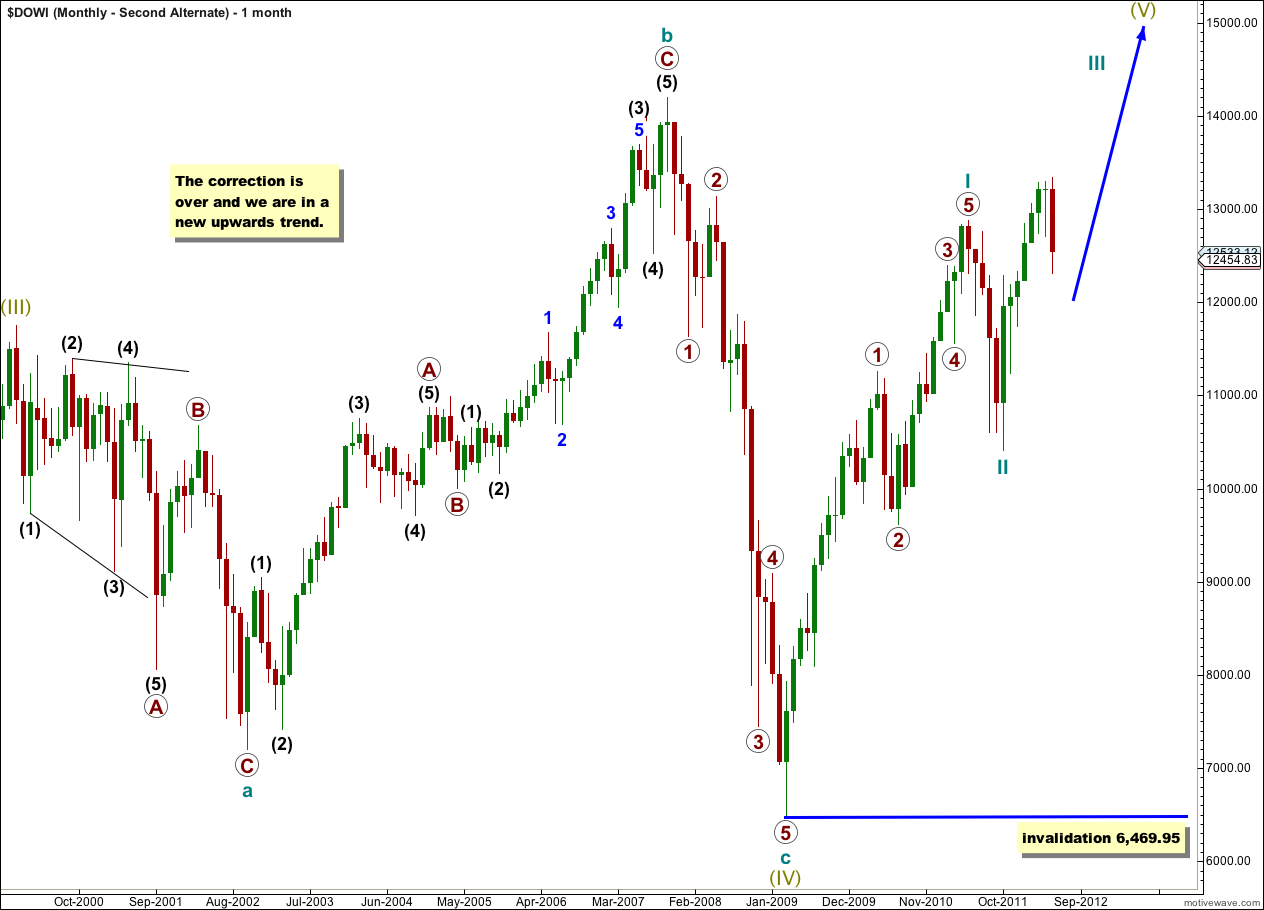
If the movement from the high labeled here super cycle wave (III) to the low labeled super cycle wave (IV) is a complete flat correction, then the entire correction may be over already.
This second alternate looks at the possibility that we are in a new bull market to last years, and that cycle wave I has probably ended.
The biggest problem with this alternate is that upwards movement labeled cycle wave I must be seen as a five wave structure, and it subdivides best into a three and has a very strong three wave look to it on monthly and weekly charts. This reduces the probability of this wave count significantly.
Within the new bull market of super cycle wave (V) cycle wave II may not move beyond the start of cycle wave I. This alternate would be invalidated with movement below 6,469.95.