
Price has moved sideways again in a decreasing range. My alternate hourly chart may be correct, which would explain all the sideways movement over the last few days. The mid term target for my main and alternate hourly charts is identical, the only question is when will the target be reached?
I have two daily charts with identical long term targets, and two hourly charts also with identical targets. They only differ in the structure expected to reach targets.
Click on the charts below to enlarge.
We have recently seen a very large trend change on the S&P 500 and a new downwards trend, to last months, has begun.
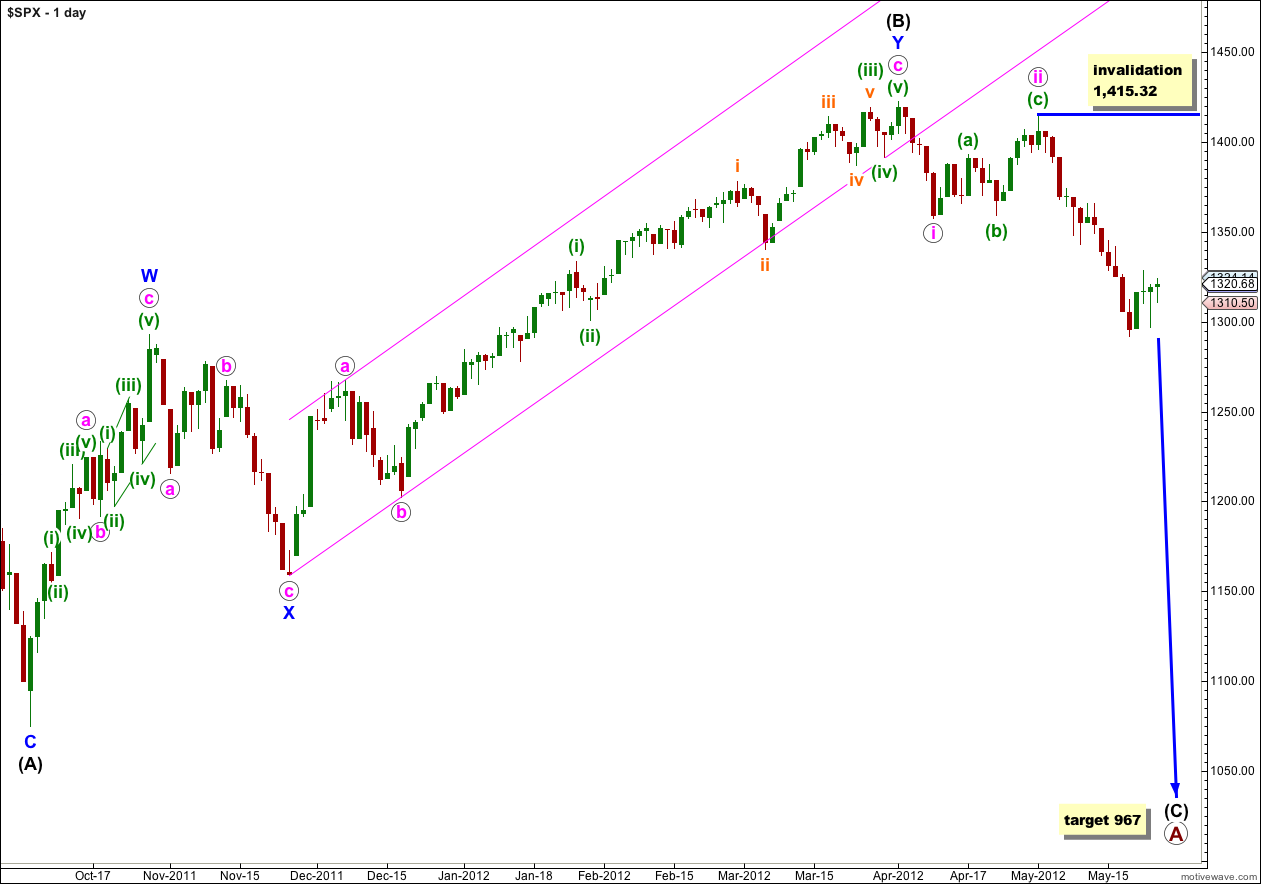
At primary degree wave A is an expanded flat correction. Wave (A) black within it subdivides into a three, and wave (B) black is over 105% of wave (A) black at 123%. The minimum requirements for an expanded flat are met. We should expect wave (C) black to subdivide into a five and move price substantially beyond the end of wave (A) black at 1,074.77.
At 967 wave (C) black would reach 1.618 the length of wave (A) black. If price continues through this first target, or it gets there and the structure is incomplete, then our second (less likely) target is at 685 where wave (C) black would reach 2.618 the length of wave (A) black.
Wave (A) black lasted 4 months. Wave (B) black lasted 6 months. We may expect wave (C) black to last at least 4 months, if not longer.
Within wave iii pink no second wave correction may move beyond the start of the first wave. This wave count is invalidated with movement above 1,415.32. When the structure of wave iii pink is complete then the invalidation point can be moved to the low of wave i pink at 1,357.38.
Main Hourly Wave Count.
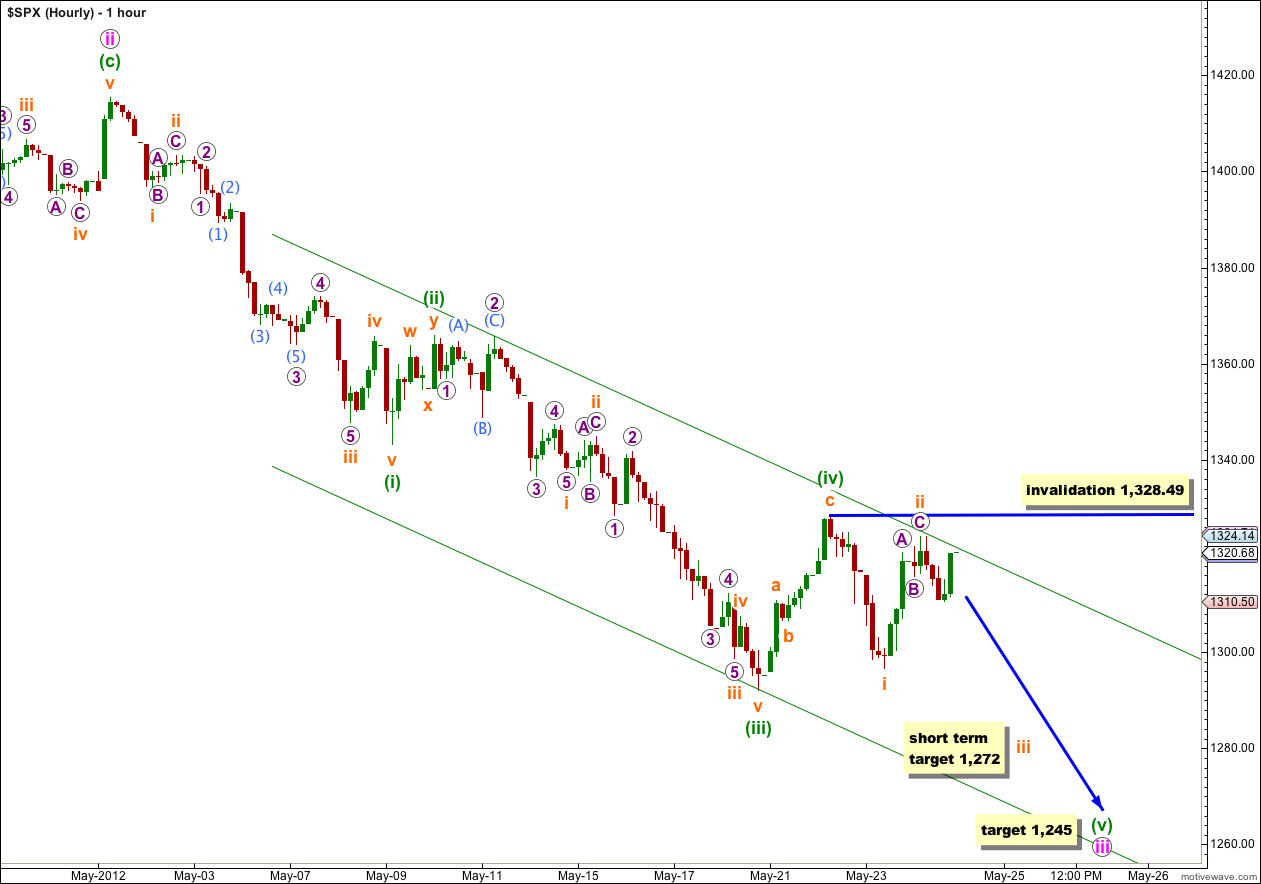
This wave count remains valid, but without strong downwards movement to new lows for Thursday’s session the probability of it has decreased while the alternate has increased.
In the short term wave iii orange would reach 1.618 the length of wave i orange at 1,272.
The structure of wave iii pink is incomplete and we should see more downwards movement yet before it is over.
In the mid term wave iii pink would reach 2.618 the length of wave i pink at 1,245. Wave iii pink has already passed 1.618 the length of wave i pink and this is the next target calculation.
When I draw the channel using Elliott’s second technique it does not quite contain downwards movement, and today I have pushed the upper green trend line out a little to sit on the high of 2 purple within i orange of (iii) green. This contains movement nicely, so far, and it looks like it should continue.
Wave (v) green to end wave iii pink may end either midway within the channel, or about the lower edge.
Wave ii orange may not move beyond the start of wave i orange. This wave count is invalidated with movement above 1,328.49.
Alternate Hourly Wave Count.
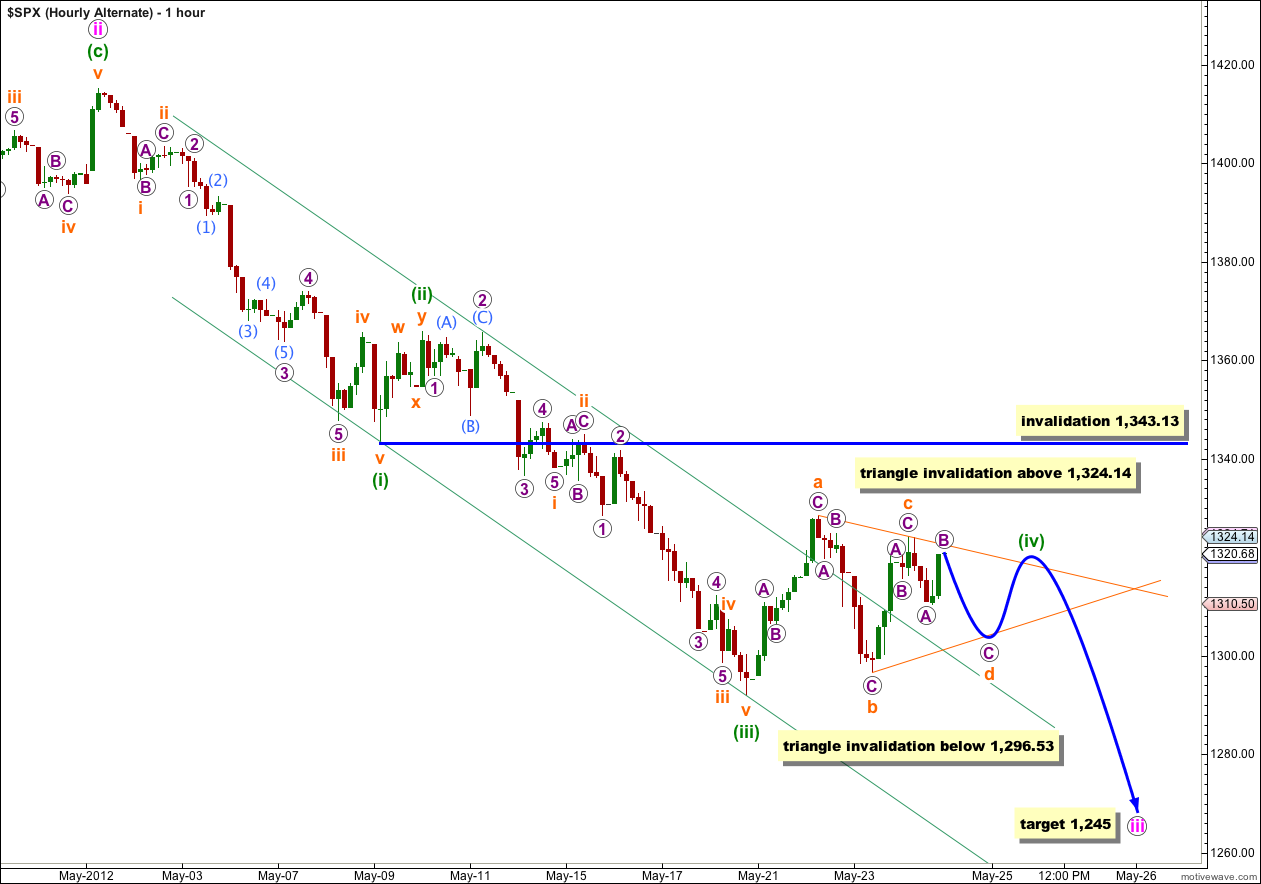
It is looking increasingly likely that a fourth wave triangle is unfolding. This structure would nicely explain all the sideways movement over the last few days.
Wave b orange was an 88% correction of wave a orange and wave c orange was an 86% correction of wave b orange. I have found this level to be typical within triangles. This all looks very good.
Wave d orange may end about 1,301 where it would be 85% of wave c orange.
Thereafter, wave e orange should end either with an overshoot of the upper a-c trend line (more likely) or possibly with an undershoot of that line (less likely).
Wave d orange may not move beyond the end of wave c. The triangle would be invalidated with movement below 1,296.53 (before completion).
Wave e orange may not move beyond the end of wave d. The triangle is invalidated with any movement above 1,324.14.
If price moves above 1,324.14 then it may be that wave (iv) green is unfolding as a flat correction. Wave (iv) green may not move into wave (i) green price territory. This wave count is invalidated with movement above 1,343.13.
Alternate Daily Wave Count.
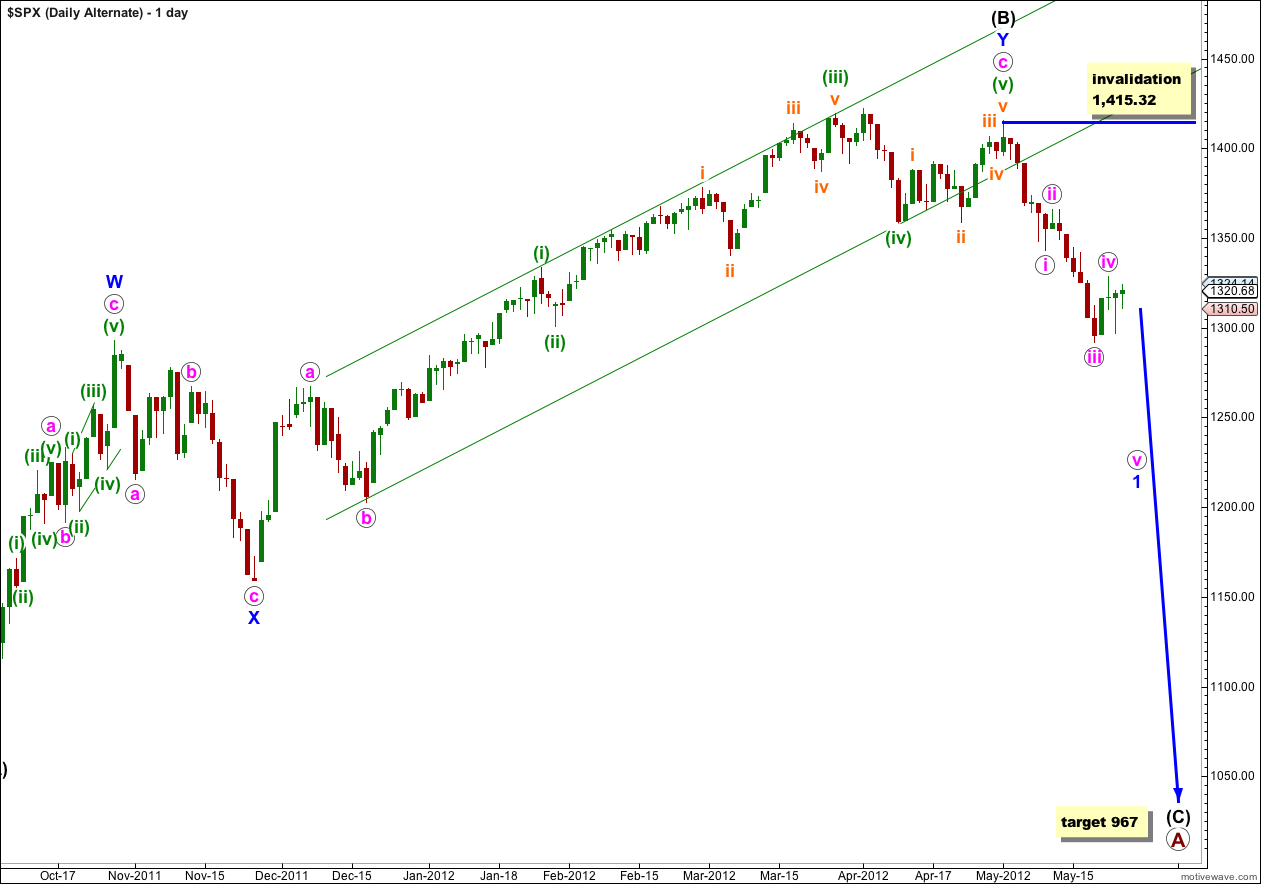
I have been aware now for a couple of weeks that my DJIA and S&P 500 wave counts do not match. This alternate is an attempt to bring them back together.
Wave (B) black may have ended at 1,415.32 with a fifth wave truncation. The truncation reduces the probability of this alternate.
If wave (C) black has more recently begun then it is probably within wave 1 blue. A fourth wave correction for wave iv pink would be either just complete or close to completion, and wave 1 blue would be incomplete. On the hourly chart this alternate would be mostly the same as our main wave count.
When wave 1 blue is complete this alternate would expect a second wave correction for wave 2 blue. Wave 2 blue can move right up to, but not above, 1,415.32.
At that stage this wave count would diverge from our main wave count. The price point which differentiates the two is 1,357.38. The main wave count would not allow movement above that price point and this alternate would see it as reasonably likely. If price did move above 1,357.38 the main wave count would be invalidated and this alternate would be our sole wave count.
At this stage this alternate does not differ in its expectation of what should happen next. This alternate requires further downwards movement to complete the five wave impulsive structure of wave 1 blue.
Have to love ascending triangle 1354 target