
Last analysis expected downwards movement during Wednesday’s session. The S&P 500 did make a new low, and thereafter bounced back upwards. Price remains below the invalidation point on the hourly chart and the wave count looks correct.
I will expect the mid term target to be met now next week, and not at the end of this week. The long term target is still months away.
I have one main daily wave count and I have developed a new alternate today. It expects exactly the same direction, but the subdivisions are different. This has no effect on expectations at this stage, but when it diverges I will define a price point which differentiates the two wave counts.
I still have the main and alternate hourly charts, with the alternate reducing further in probability today.
Click on the charts below to enlarge.
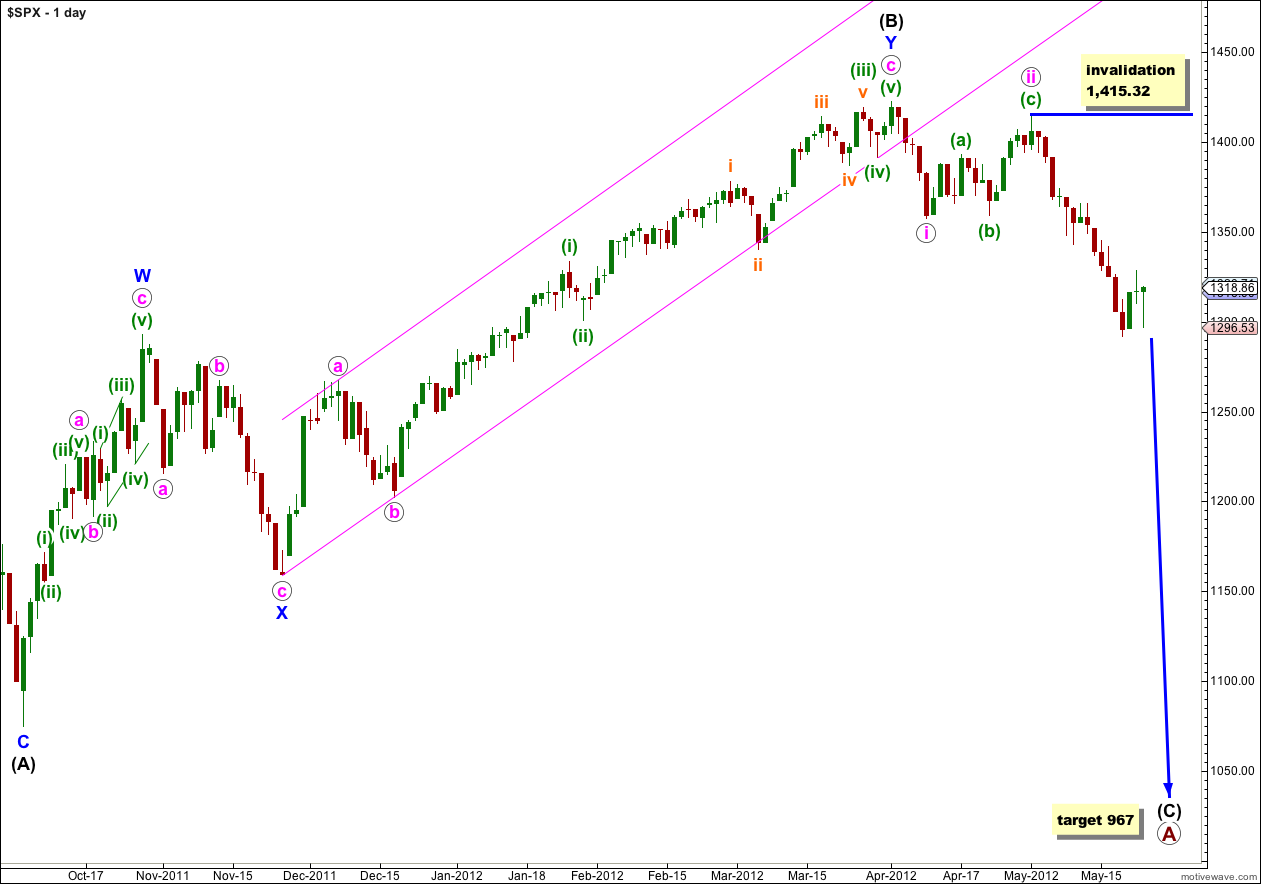
We have recently seen a very large trend change on the S&P 500 and a new downwards trend, to last months, has begun.
At primary degree wave A is an expanded flat correction. Wave (A) black within it subdivides into a three, and wave (B) black is over 105% of wave (A) black at 123%. The minimum requirements for an expanded flat are met. We should expect wave (C) black to subdivide into a five and move price substantially beyond the end of wave (A) black at 1,074.77.
At 967 wave (C) black would reach 1.618 the length of wave (A) black. If price continues through this first target, or it gets there and the structure is incomplete, then our second (less likely) target is at 685 where wave (C) black would reach 2.618 the length of wave (A) black.
Wave (A) black lasted 4 months. Wave (B) black lasted 6 months. We may expect wave (C) black to last at least 4 months, if not longer.
Within wave iii pink no second wave correction may move beyond the start of the first wave. This wave count is invalidated with movement above 1,415.32. When the structure of wave iii pink is complete then the invalidation point can be moved to the low of wave i pink at 1,357.38.
Main Hourly Wave Count.
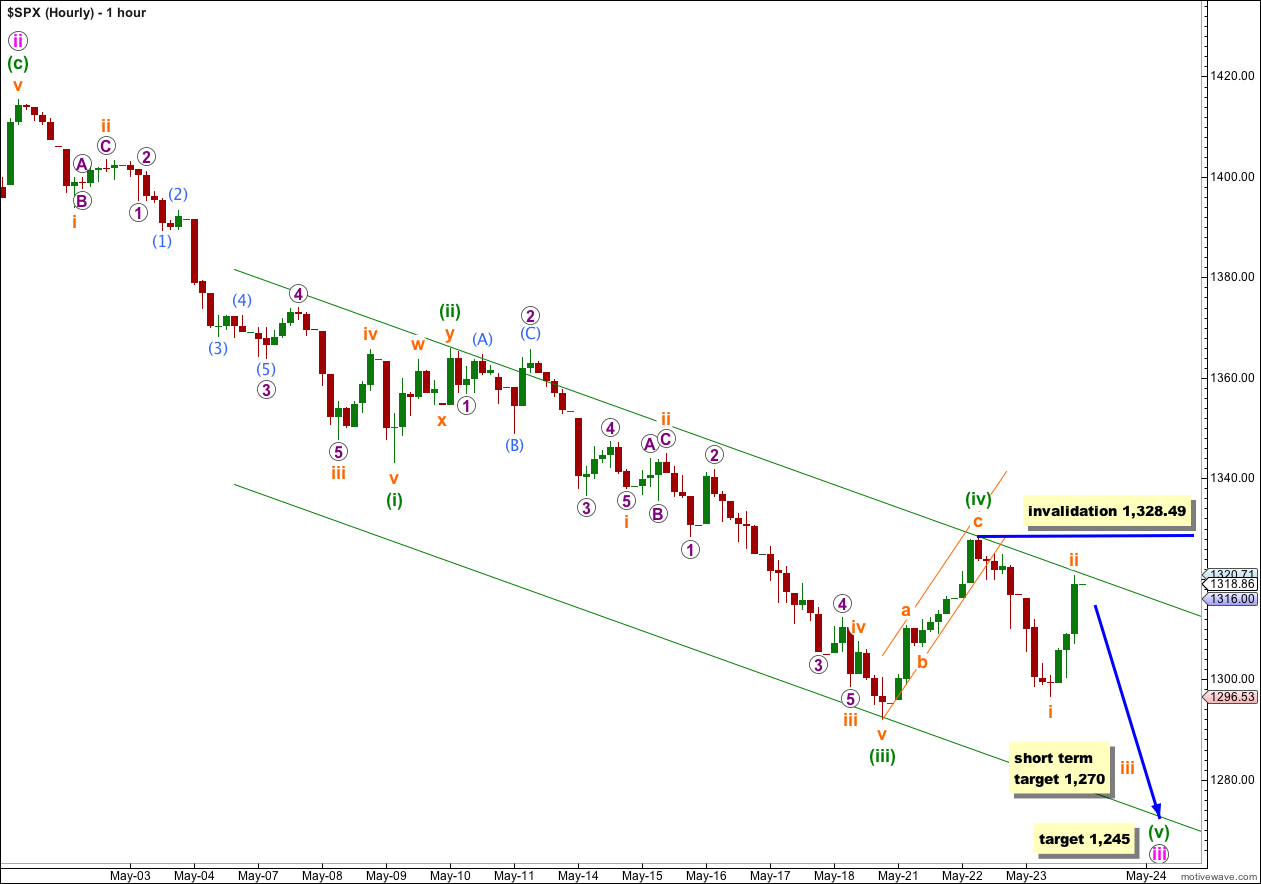
Wave (v) green may have begun with the completion of waves i and ii orange during Wednesday’s session. On the 5 minute chart wave i orange subdivides absolutely perfectly into a five wave impulse, and wave ii orange also subdivides nicely into a three wave zigzag. On the 5 minute chart movement below 1,306.11 would increase the probability that wave ii orange is over and wave iii orange is underway.
In the short term wave iii orange would reach 1.618 the length of wave i orange at 1,270. If this wave count is correct then this target may be met tomorrow, or possibly the day after.
The mid term target at 1,245 remains the same, where wave iii pink would reach 2.618 the length of wave i pink.
Wave ii orange may not move beyond the start of wave i orange. This wave count is invalidated with movement above 1,328.49.
I have redrawn the parallel channel today using Elliott’s second technique. The first trend line is drawn from the highs of (ii) to (iv) green, then a parallel copy is placed upon the low of (iii) green. This redrawn channel may better show us where wave (v) green ends; it may end either mid way in the channel or possibly at the lower edge.
If wave ii orange moves a little higher tomorrow then it may not move beyond the start of wave i orange. This wave count is invalidated with movement above 1,328.49. I would expect upwards movement to find resistance at the upper edge of this channel.
If price moves above 1,328.49 in the next couple of days or so then we may use the alternate below.
Alternate Hourly Wave Count.
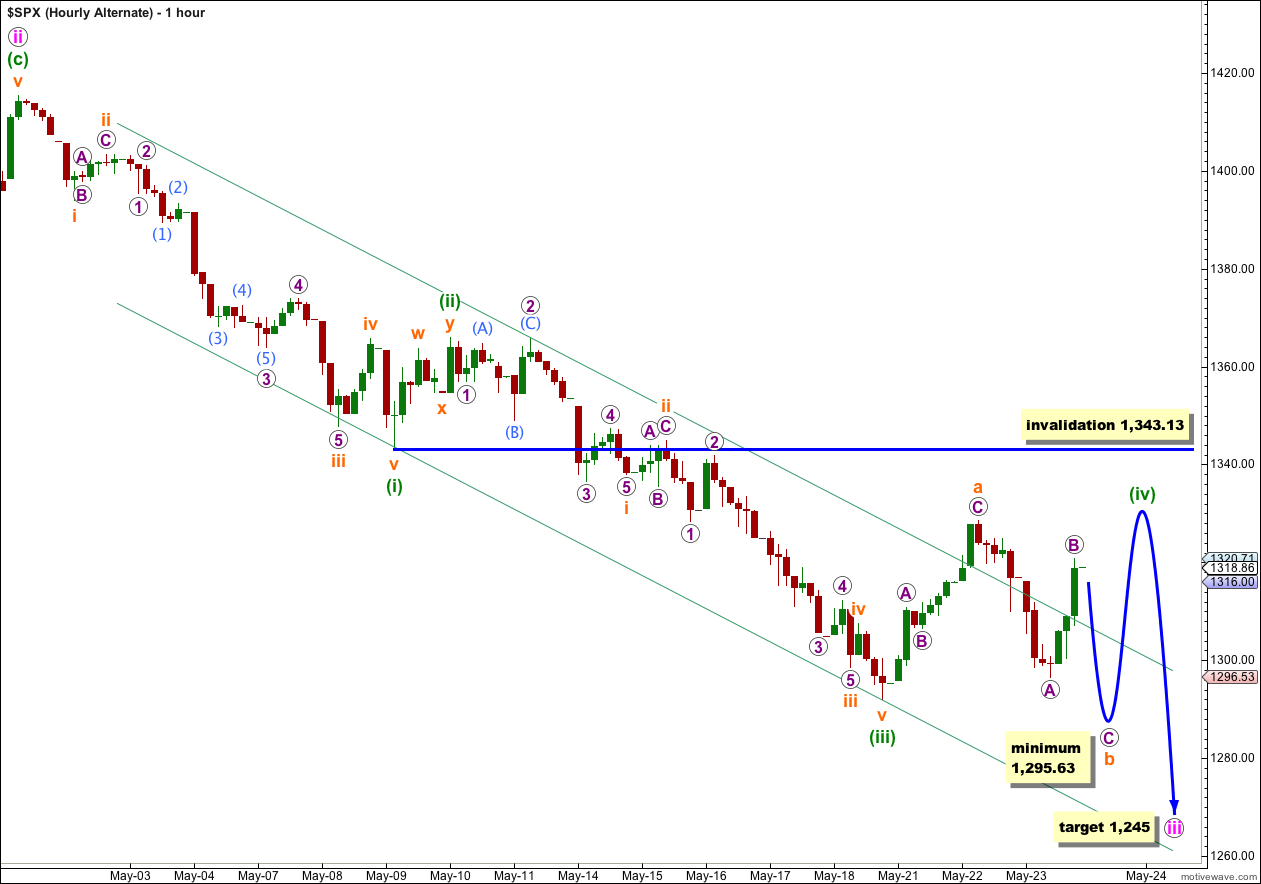
It is still possible that wave (iv) green is continuing further sideways, but today it is even less likely because it is now becoming hugely out of proportion to wave (ii) green in duration.
If wave (iv) green is a flat correction then wave b orange within it must reach at least 90% the length of wave a orange. This would be achieved at 1,295.63. Wave A purple is only an 87% length of wave a orange and the minimum requirement for a flat has not yet been met. Wave b orange may be still underway as a large exaggerated three wave movement.
It is also possible today that wave (iv) green is unfolding as a triangle. If that is the case then price should remain within a decreasing range, below 1,328.49 and above 1,296.53 moving sideways for another two or so sessions. I will keep this unlikely possibility in mind and will chart it for you if it shows itself to be correct.
If wave (iv) green is continuing as a flat correction then tomorrow we should see another downwards wave to at least 1,295.63 and thereafter an upwards wave which is extremely likely to end above 1,328.49 but may not move back into wave (i) green price territory above 1,343.13.
Because wave (iv) green is so time consuming the probability of this alternate further reduces.
Alternate Daily Wave Count.
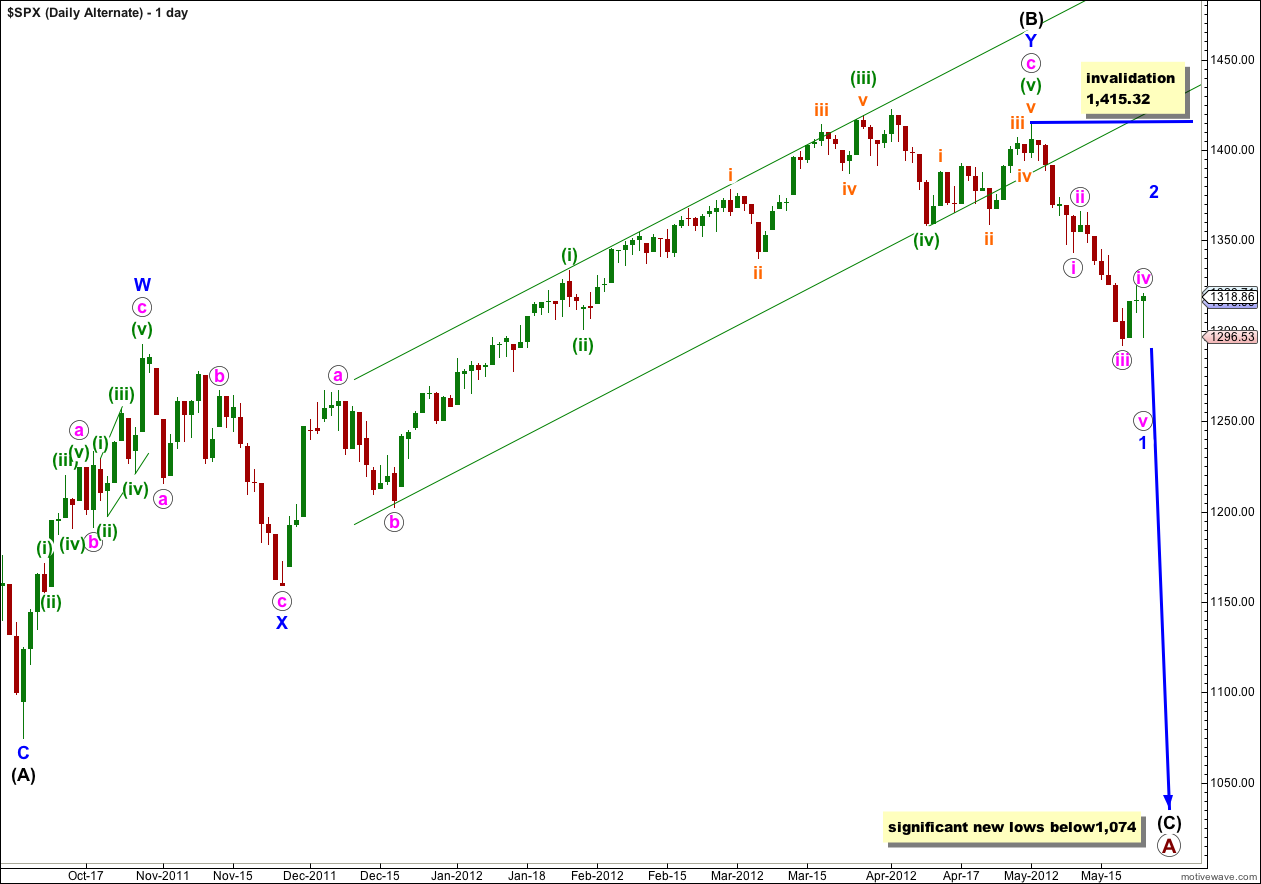
I have been aware now for a couple of weeks that my DJIA and S&P 500 wave counts do not match. This alternate is an attempt to bring them back together.
Wave (B) black may have ended at 1,415.32 with a fifth wave truncation. The truncation reduces the probability of this alternate.
If wave (C) black has more recently begun then it is probably within wave 1 blue. A fourth wave correction for wave iv pink would be either just complete or close to completion, and wave 1 blue would be incomplete. On the hourly chart this alternate would be mostly the same as our main wave count.
When wave 1 blue is complete this alternate would expect a second wave correction for wave 2 blue. Wave 2 blue can move right up to, but not above, 1,415.32.
At that stage this wave count would diverge from our main wave count. The price point which differentiates the two is 1,357.38. The main wave count would not allow movement above that price point and this alternate would see it as reasonably likely. If price did move above 1,357.38 the main wave count would be invalidated and this alternate would be our sole wave count.
At this stage this alternate does not differ in its expectation of what should happen next. This alternate requires further downwards movement to complete the five wave impulsive structure of wave 1 blue.
Lara,
Thank you for your continued excellent analysis. I have a suggestion I ask you to consider. In your commentary, you refer to waves by their color. That is fine but I, and perhaps some others think of waves according to their size names (Primary, Minor, Minute, etc.). Would you please consider posting a reference chart equating color with wave size on the same page where your daily commentary appears. Or, include the size name along with the color. I do know that you have a master chart of wave size/color somewhere in the website.
Regards,
Gene Heil
Here is the wave notation file:
http://elliottwavestockmarket.com/2010/08/24/wave-notation/
Perhaps I should put it into its own category titled “wave notation” so that it is easier to find.
I have the notation devised so that people who are colour blind can distinguish one from the other.
DO you STILL feel STRONG about 967????
Yes.