
I had expected overall downwards movement for Tuesday’s session and price has moved sideways closing less than a point higher than the open.
I have only one daily wave count and two hourly wave counts again today. The main hourly wave count now has increased in probability and is much more likely than the alternate.
Click on the charts below to enlarge.
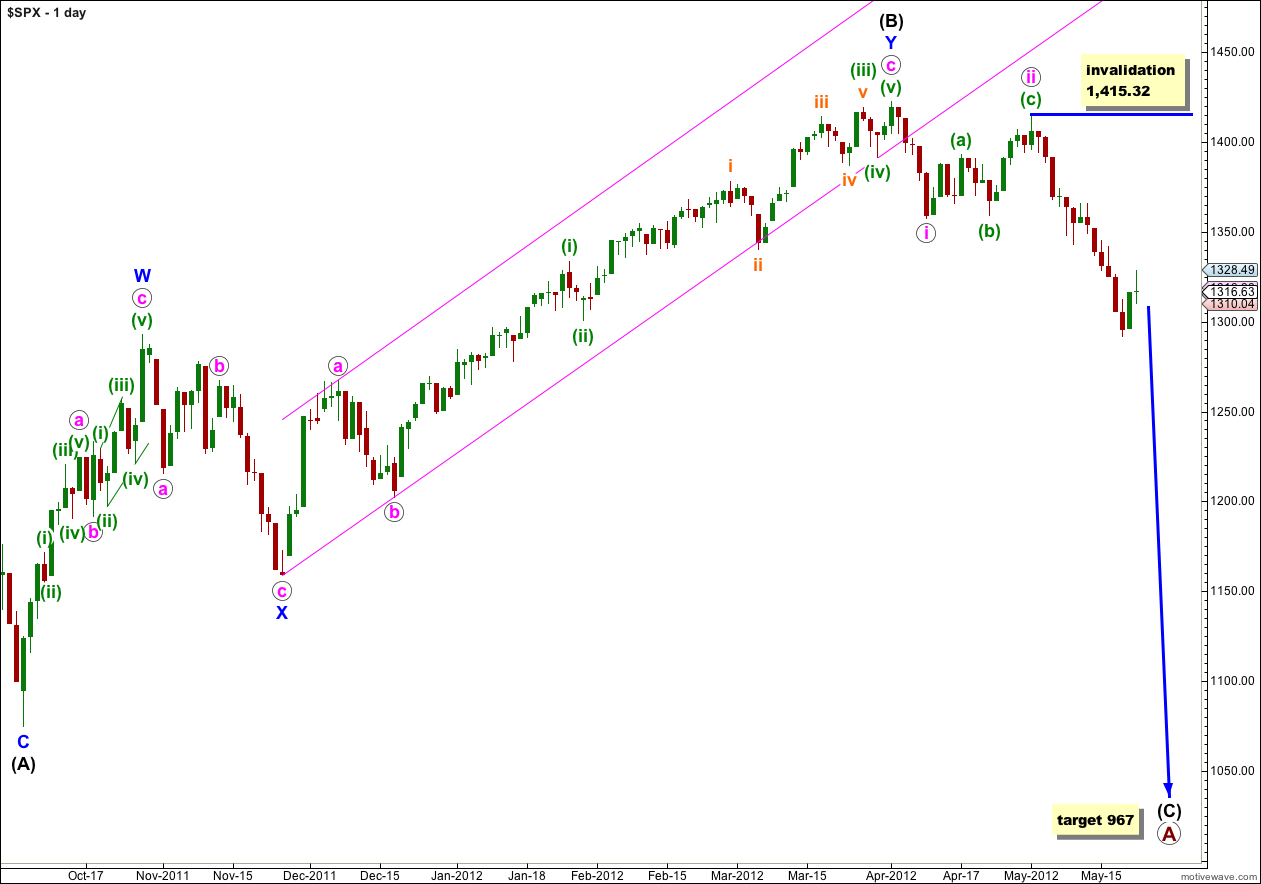
We have recently seen a very large trend change on the S&P 500 and a new downwards trend, to last months, has begun.
At primary degree wave A is an expanded flat correction. Wave (A) black within it subdivides into a three, and wave (B) black is over 105% of wave (A) black at 123%. The minimum requirements for an expanded flat are met. We should expect wave (C) black to subdivide into a five and move price substantially beyond the end of wave (A) black at 1,074.77.
At 967 wave (C) black would reach 1.618 the length of wave (A) black. If price continues through this first target, or it gets there and the structure is incomplete, then our second (less likely) target is at 685 where wave (C) black would reach 2.618 the length of wave (A) black.
Wave (A) black lasted 4 months. Wave (B) black lasted 6 months. We may expect wave (C) black to last at least 4 months, if not longer.
Within wave iii pink no second wave correction may move beyond the start of the first wave. This wave count is invalidated with movement above 1,415.32. When the structure of wave iii pink is complete then the invalidation point can be moved to the low of wave i pink at 1,357.38.
Main Hourly Wave Count.
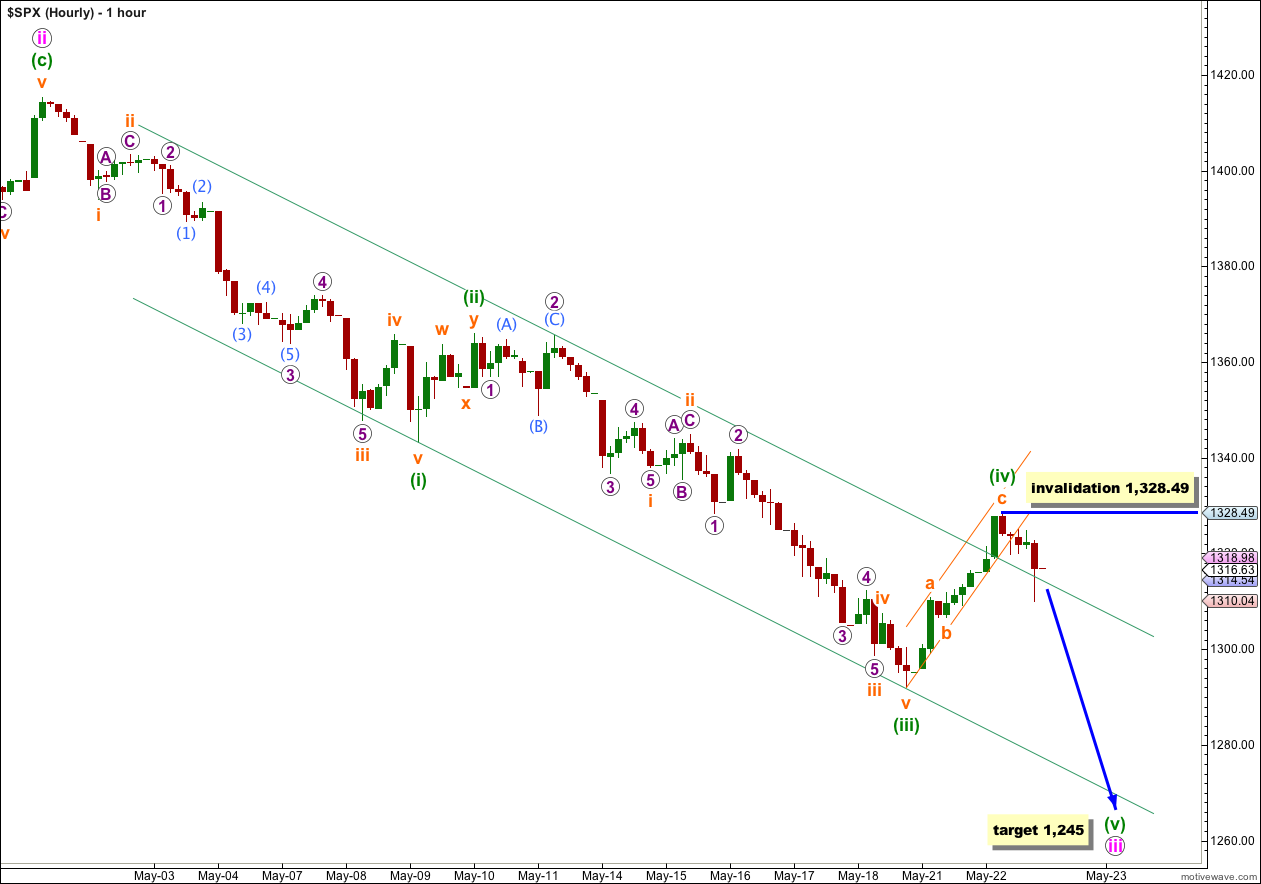
We now have a clear overshoot of the parallel channel for this fourth wave correction as wave c orange moved higher to begin Tuesday’s session. There is no Fibonacci ratio between waves a and c orange within wave (iv) green.
There is now better alternation between waves (ii) and (iv) green. Wave (ii) green was a shallow 31% double zigzag and wave (iv) green is relatively deeper at 49%, as a single zigzag.
Wave (iv) green has now lasted two sessions and is perfectly in proportion to wave (ii) green, which also lasted two sessions.
Sometimes when fourth waves overshoot the channel we may see a fifth wave overshoot to follow in the opposite direction. Although it has been my experience that it is still more likely the fifth wave would end about midway within the channel.
Wave (iii) green is just 1.71 points longer than equality with wave (i) green. With such a good ratio between these two actionary waves it is less likely we shall see a Fibonacci ratio between wave (v) green and either of (i) or (iii) green.
At 1,245 wave iii pink would reach 2.618 the length of wave i pink.
As wave (v) green unfolds I will use ratios between waves at orange degree within it to further refine the target, and please understand this target may change.
Within wave (v) green no second wave correction may move beyond the start of its first wave. This wave count is invalidated with movement above 1,328.49.
At this stage if the wave count is invalidated by upwards movement then I expect it would not be wave c orange continuing higher and I would discard this main wave count and use only the alternate below.
Alternate Hourly Wave Count.
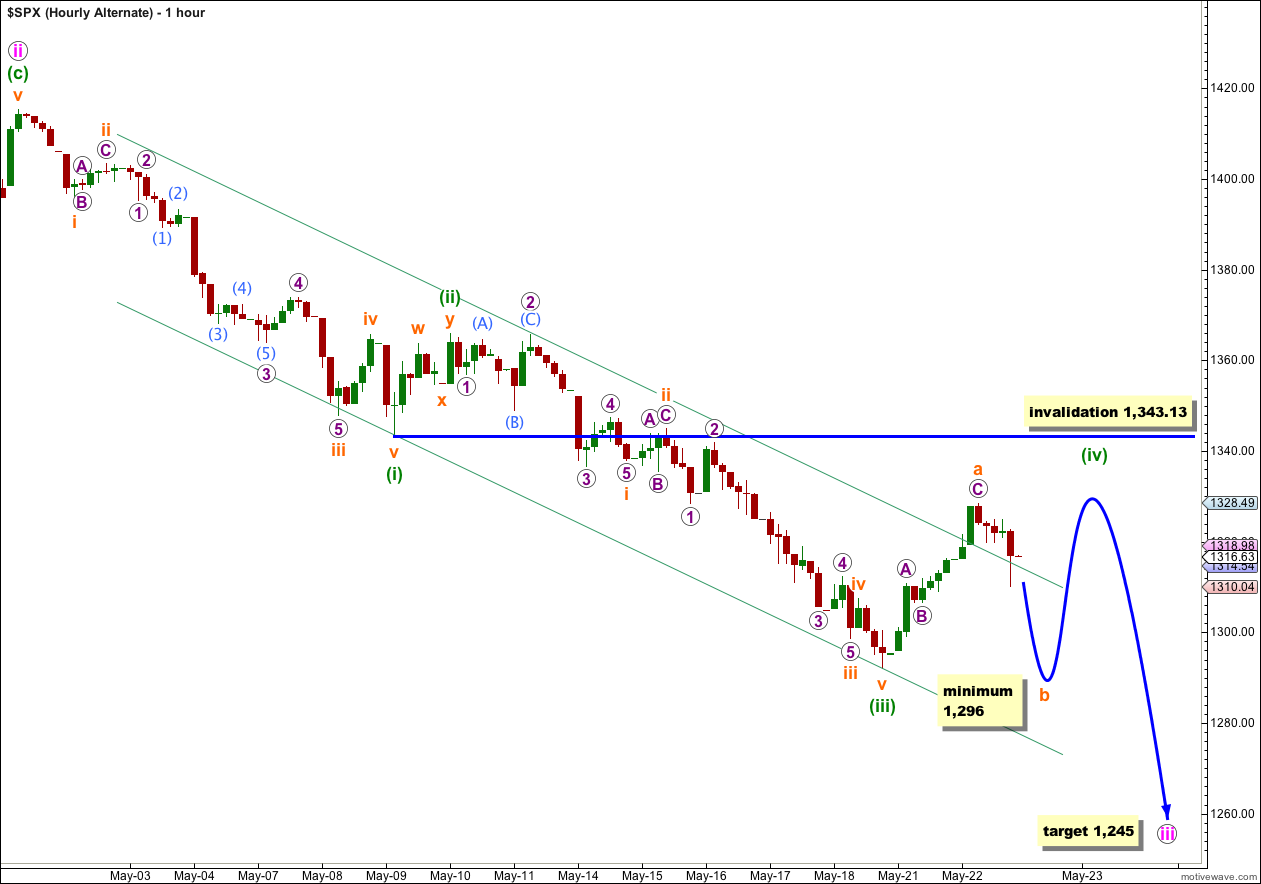
This alternate is the same idea as yesterday’s alternate. If we simply move the degree of labeling within wave (iv) green down one degree it may be only wave a orange within wave (iv) green which is complete.
I would expect wave (iv) green for this alternate to be a flat correction and not a double zigzag because that would not see alternation in structure with wave (ii) green. A flat correction requires wave b orange to be at least 90% the length of wave a orange. This would now be achieved at 1,296 and this alternate requires downwards movement tomorrow to at least that point.
When price reaches 1,296 look at the structure within b orange carefully, and you may need to use a 5 minute chart to do this. If it looks like a three then this alternate may be correct. However, if it looks more like a five then the main hourly wave count would be more likely correct.
Within a flat correction wave b orange may make a new low below the start of wave a orange at 1,291.98, and in fact it is most likely to do so. The most common type of flat is an expanded flat which requires wave b orange to reach at least 1,290 where it would be 105% the length of wave a orange.
Wave (iv) green may not move into wave (i) green price territory. This wave count is invalidated with movement above 1,343.13.
looks like the alternative hourly count was correct 🙂
possibly, but not necessarily. this could be, and looks like so far, a deep second wave correction. until price moves above 1,328.49 it is probably still wave (v) green
Is that following chart possible(from Elliott Wave Predictions)? Wave 3 start on today(Web).
http://elliottwavepredictions.com/wp-content/uploads/2012/05/SPX-120m-5-17-12.png
it’s possible, and the idea that (C) black began more recently at 1,415.32 is a possibility I have considered and may chart. at this stage it makes little difference in what we should see next.
this wave count would be expecting a deep retracement at this stage though, not a third wave to start Wednesday