
Yesterday’s main wave count expected at least a little upwards movement. Our target of 1,395 to 1,396 was exceeded by just over 6 points.
Both our main and alternate daily wave counts remain valid. We still need to see price break out of this range before we shall have clarity. However, the main wave count does remain more likely because subdivisions have a better fit.
Click on the charts below to enlarge.
Main Wave Count.
I have adjusted the labeling within wave (ii) green slightly, and this has a higher probability. It may be a regular flat correction which could have been over with Thursday’s upwards movement. This looks very typical.
Price remains below 1,422.38 and this wave count remains not only valid but still has a higher probability than our alternate.
Movement below 1,357.38 would add significant confidence to this wave count. At that stage I will discard the alternate.
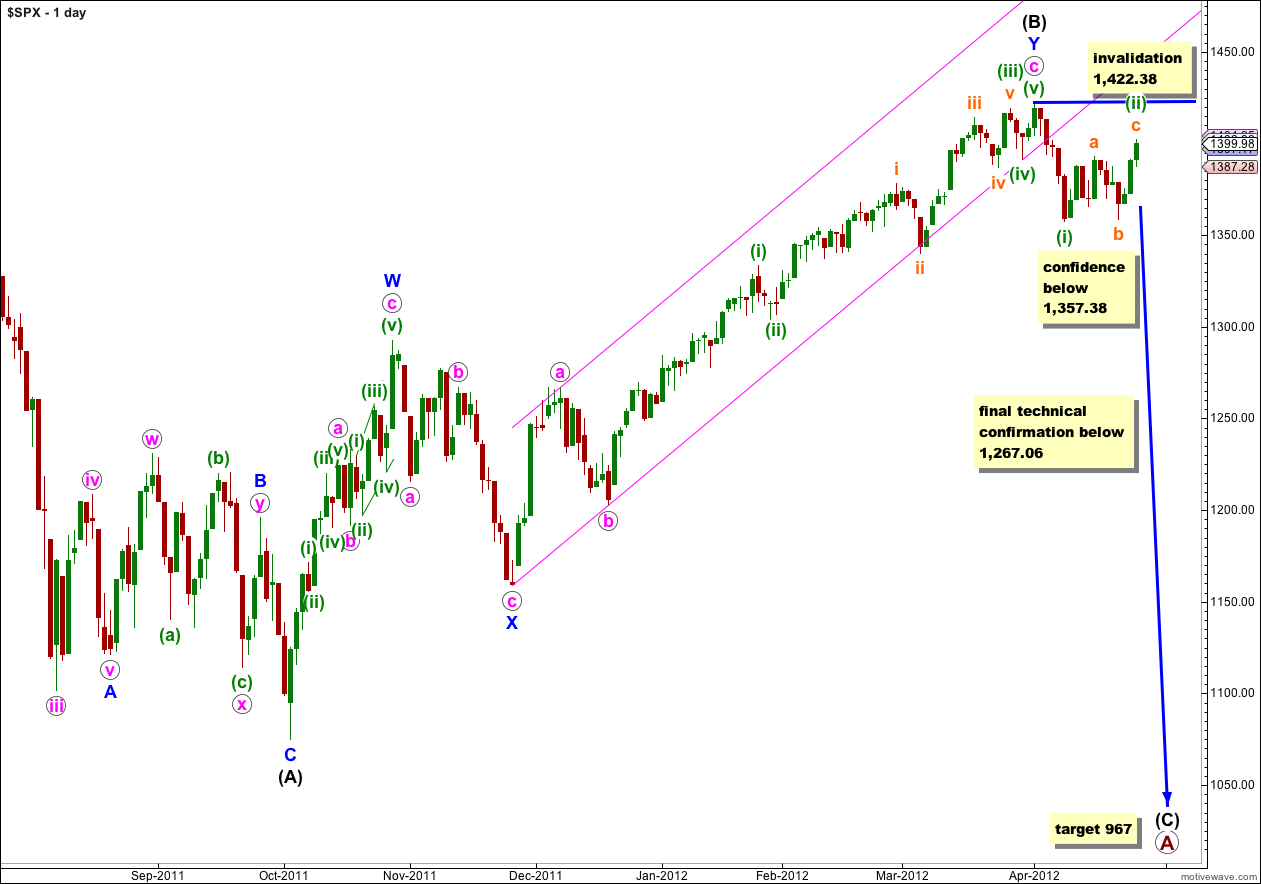
At primary degree wave A would be an expanded flat correction because wave (B) black is a 123% correction of wave (A) black. We would expect wave (C) black to most likely reach 1.618 the length of wave (A) black a 967. If price moves through this first target then the next (less likely) target would be where wave (C) black reaches 2.618 the length of wave (A) black at 685.
For this main daily wave count I have two hourly charts below. The first, main hourly wave count, has a higher probability.
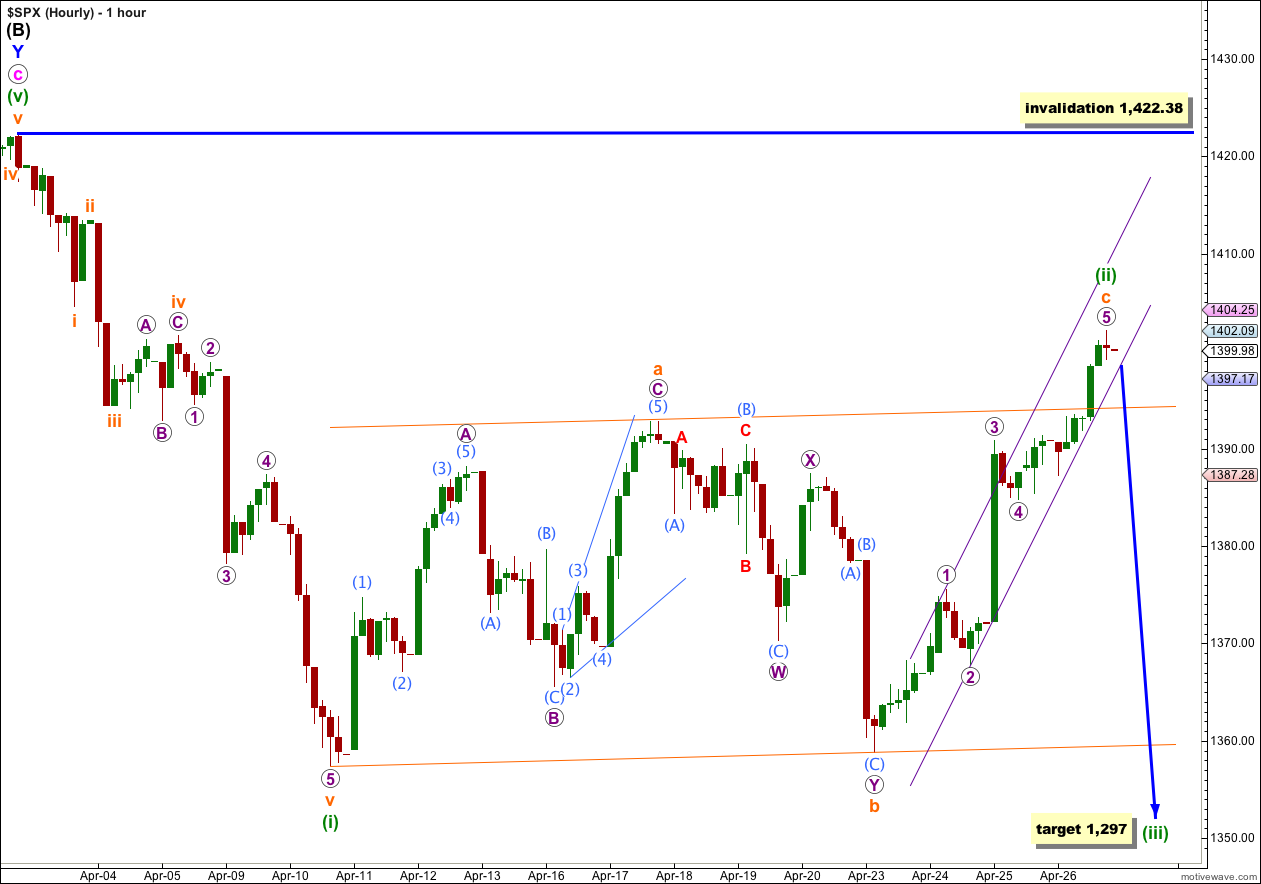
This is the wave count that I should have seen yesterday. Wave (ii) green may be unfolding as a regular flat correction. Wave b orange, a double zigzag, is a 96% correction of wave a orange. If wave c orange is complete it has no Fibonacci ratio to wave a orange.
Within wave a orange wave C purple has no Fibonacci ratio to wave A purple.
Wave b orange is a double zigzag and we would not expect to see a ratio between waves W and Y purple.
Within wave c orange there is no Fibonacci ratio between wave 3 purple and wave 1 purple, and wave 5 purple is just 0.53 points longer than equality with wave 1 purple.
We may use Elliott’s channeling technique to draw a parallel channel about this entire structure. Wave c orange has overshot this channel which is reasonably common for a regular flat correction. When this channel is breached by downwards movement then we may have confirmation that wave (ii) green is over and wave (iii) green would then be underway.
We may also draw a best fit parallel channel about wave c orange. When this channel is clearly breached by downwards movement then we have indication that at least in the short term the upwards wave is over and a new wave down has begun.
At 1,297 wave (iii) green would reach 1.618 the length of wave (i) green.
Wave (ii) green may not move beyond the start of wave (i) green. This wave count is invalidated with movement above 1,422.38.
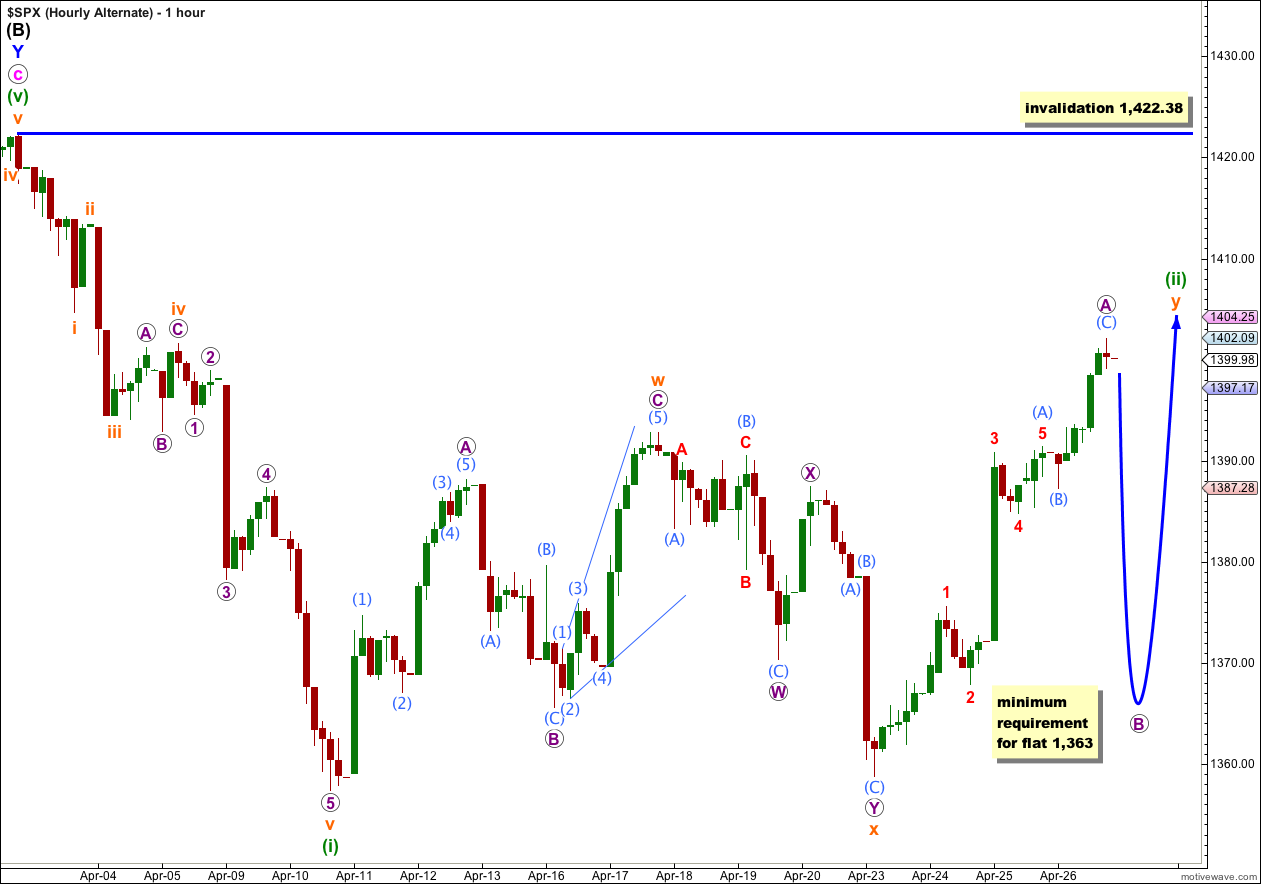
This alternate wave count follows on directly from yesterday’s hourly wave counts. If wave (ii) green is unfolding as a double combination then it would be likely that wave y orange, the second structure in the double, is incomplete.
There is more than one way to see the last upwards movement labeled here A purple within y orange. Here I am labeling it as a possible complete zigzag, a three wave structure. It could also be a five as labeled on the main hourly chart. This means wave y orange may be either a flat or a zigzag.
This wave count has a lower probability than the main hourly count for two reasons: a double is less common than a single flat correction, and this alternate sees wave (ii) green as longer lasting and disproportionate to wave (i) green. However, all subdivisions fit and we must consider this possibility.
If wave y orange is unfolding as a flat then wave B purple must be at least 90% the length of wave A purple and it must subdivide into a three. This would be achieved at 1,363. Thereafter, wave C purple upwards should end above 1,402.09.
If wave y orange is unfolding as a zigzag then there is no downwards requirement for wave B purple, but it must subdivide into a three and may not make a new low below 1,358.79.
If this alternate wave count is correct then we should expect a few more days of overall sideways movement. If we see a clear five wave structure downwards then this wave count may be discarded.
Alternate Daily Wave Count.
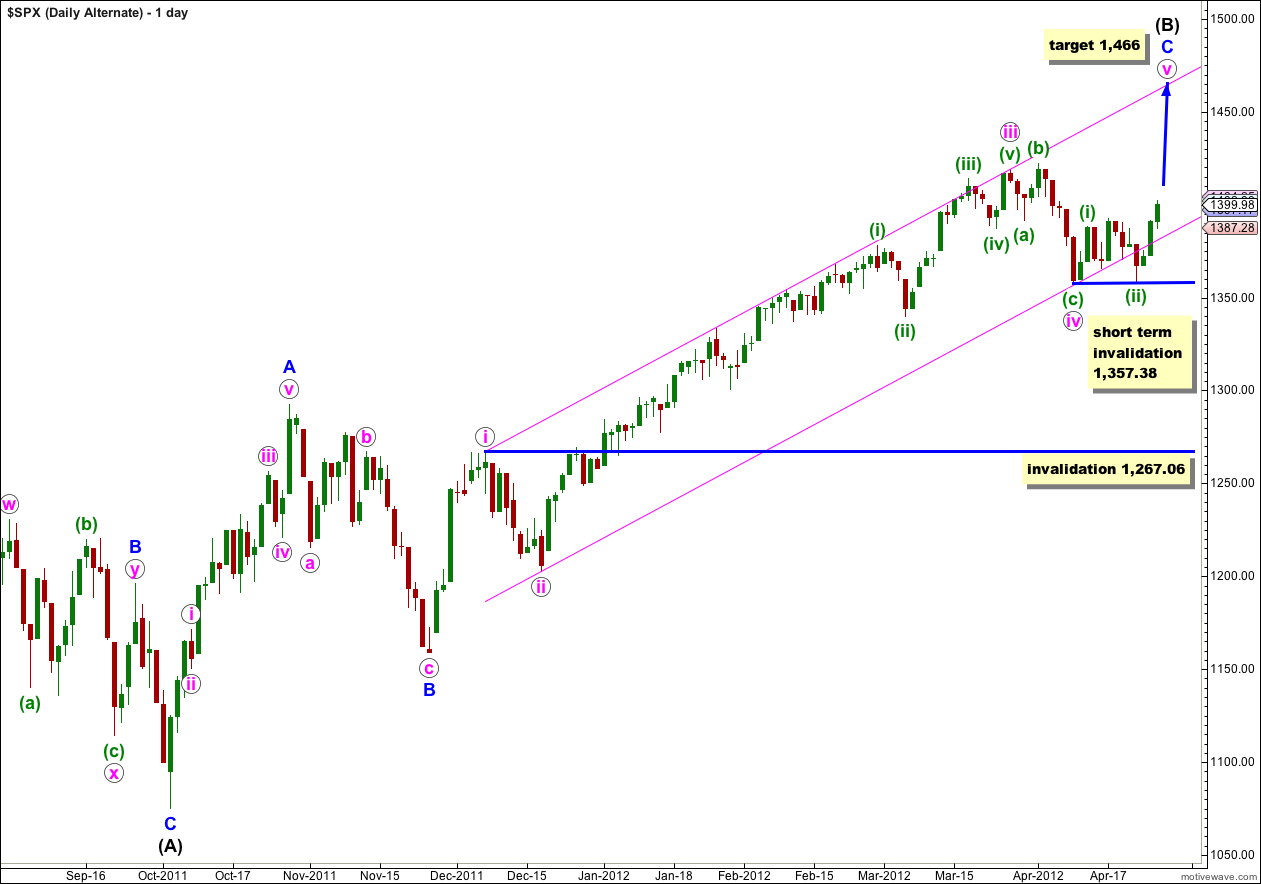
With price reentering this channel and the breach being very small and now unconvincing, this wave count remains valid. However, the subdivisions do not have nearly as good a fit as the main wave count, particularly within the upwards wave labeled here A blue within (B) black. This reduces the probability of this wave count.
Although the channel breach is unconvincing it is still a breach and this also reduces the probability of this wave count.
Within wave v pink waves (i) and (ii) green would be complete. Within wave (ii) green wave C of this flat does not subdivide into a five wave structure, and as a very rare triple (in which the subdivisions would fit) it has the wrong look. This also reduces the probability of this wave count.
We need to see movement below 1,357.38 before we can discard this wave count. Wave (ii) green may not move beyond the start of wave (i) green. At that point this wave count would be initially invalidated.
Any further extension of wave iv pink may not move into wave i pink price territory. This wave count would be finally invalidated with movement below 1,267.06.
We sold everything and went short just before the close today… 38.2% Fib needs to hold now 1382.21 IMO
I loved your report yesterday.
Thank you!
Great Karen! It sure does look really typical; that we’ve had a first impulse down which lasted 5 days, and a big flat correction which lasted 13 days. The subdivisions look so good. I sure do hope I’m right on this one and that it is going to turn down Monday and keep falling! While I travel over to Fiordland I’ll have my fingers crossed for all members!
A deep pullback in the next couple days would be an indication that an ED could transpire too??
Bulkowski’s Ending Diagonal Triangle http://www.thepatternsite.com/EWDiagTriangle.html
IHS Head: 1359 Neckline: 1393 = 1427