
Yesterday’s analysis expected downwards movement which is what we have seen for Thursday’s session. Price has again found strong support at the lower edge of the parallel channel on our alternate daily wave count. Tomorrow’s session will again be crucial. Will price break through this resistance increasing the probability of our main wave count? Or will price again bounce upwards from here increasing the probability of our alternate wave count?
For the main wave count I have again two hourly wave counts looking at most recent movement slightly differently.
Click on the charts below to enlarge.
Main Wave Count.
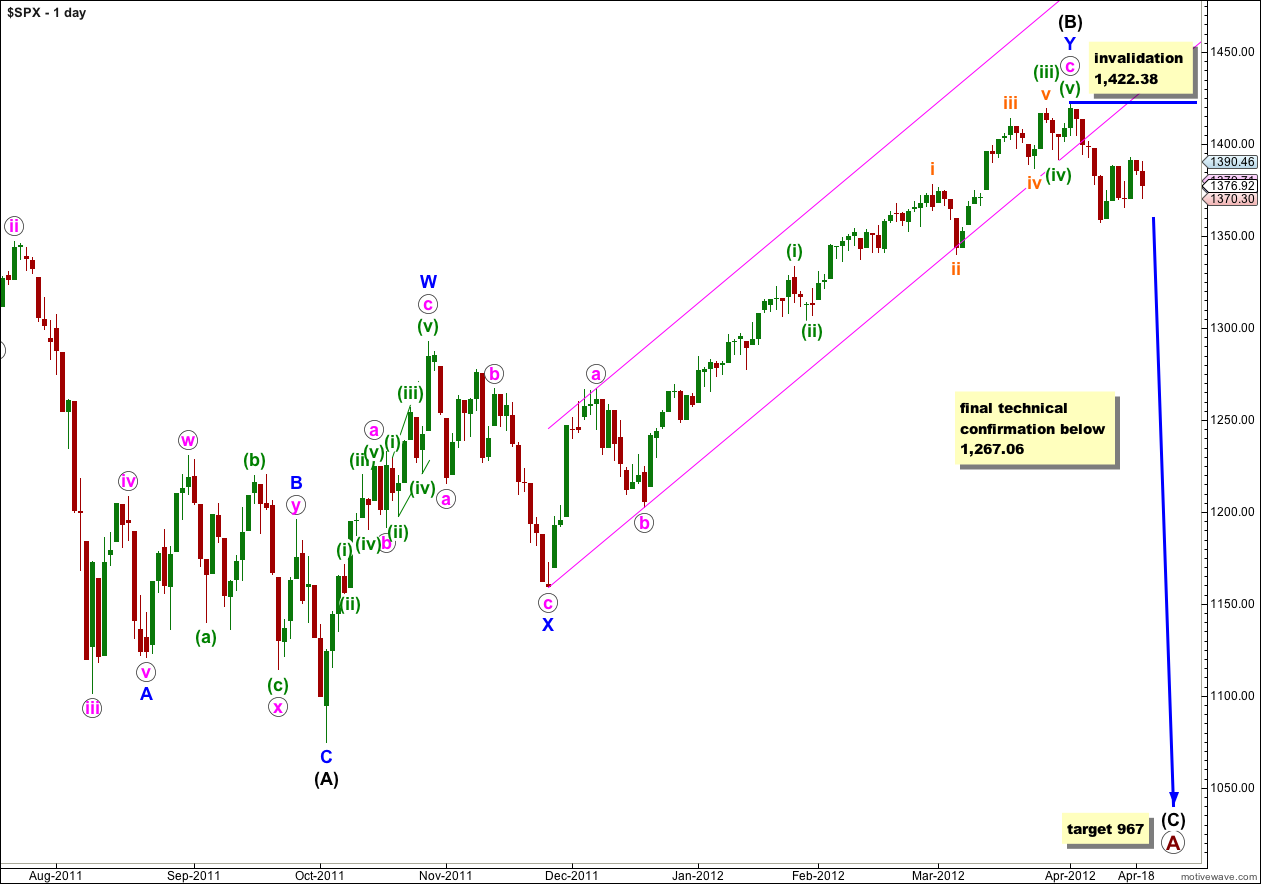
This main wave count remains slightly more likely than our alternate. This is because the subdivisions within W blue of (B) black have a much better fit. Within wave c pink of wave Y blue the subdivisions also fit perfectly and there are good Fibonacci ratios within it.
At primary degree wave A would be an expanded flat correction because wave (B) black is a 123% correction of wave (A) black. We would expect wave (C) black to most likely reach 1.618 the length of wave (A) black a 967. If price moves through this first target then the next (less likely) target would be where wave (C) black reaches 2.618 the length of wave (A) black at 685.
If this wave count is correct then I expect that our main hourly wave count below would be the best fit, and have the highest probability. If price remains below 1,390.46 tomorrow this main daily and main hourly wave count will remain our highest probability. If price makes a new low below 1,357.38 tomorrow or the day after then this wave count will significantly increase in probability and I would probably then discard the alternate daily wave count. Below this price point we may have a lot more confidence in a major trend change for the S&P 500.
Main Hourly Wave Count.
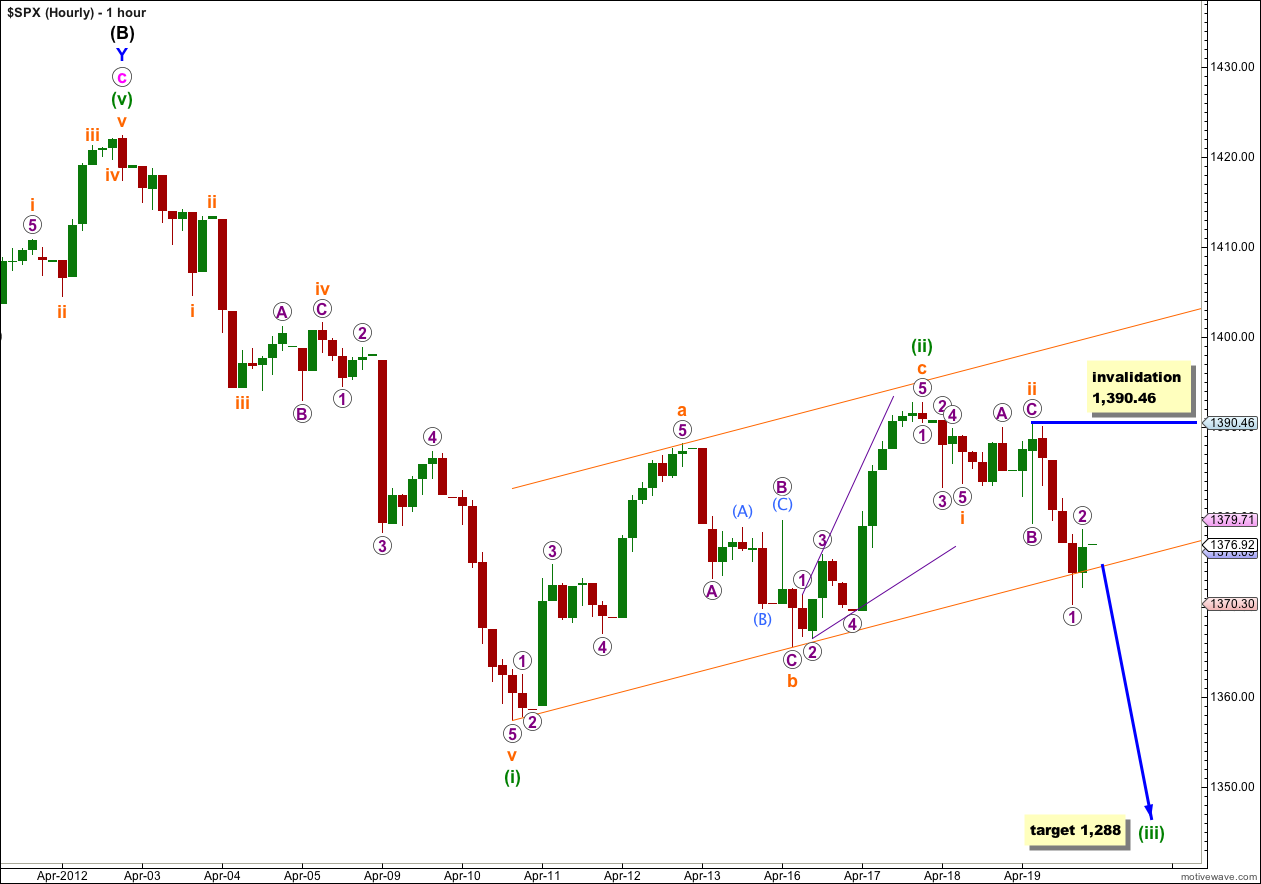
This wave count remains our main wave count with the highest probability. Price has slightly overshot the lower edge of the parallel channel containing wave (ii) green. If price manages to break through this channel tomorrow then this wave count would significantly increase in probability.
Within wave (iii) green wave i orange may be complete. Within wave iii orange waves 1 and 2 purple may be complete (on the 5 minute chart wave 2 purple subdivides into a nice zigzag structure). If wave 2 purple moves any higher as a double zigzag or flat correction then it may not move beyond the start of wave 1 purple at 1,390.46.
At 1,288 wave (iii) green would reach 1.618 the length of wave (i) green.
Alternate Hourly Wave Count.
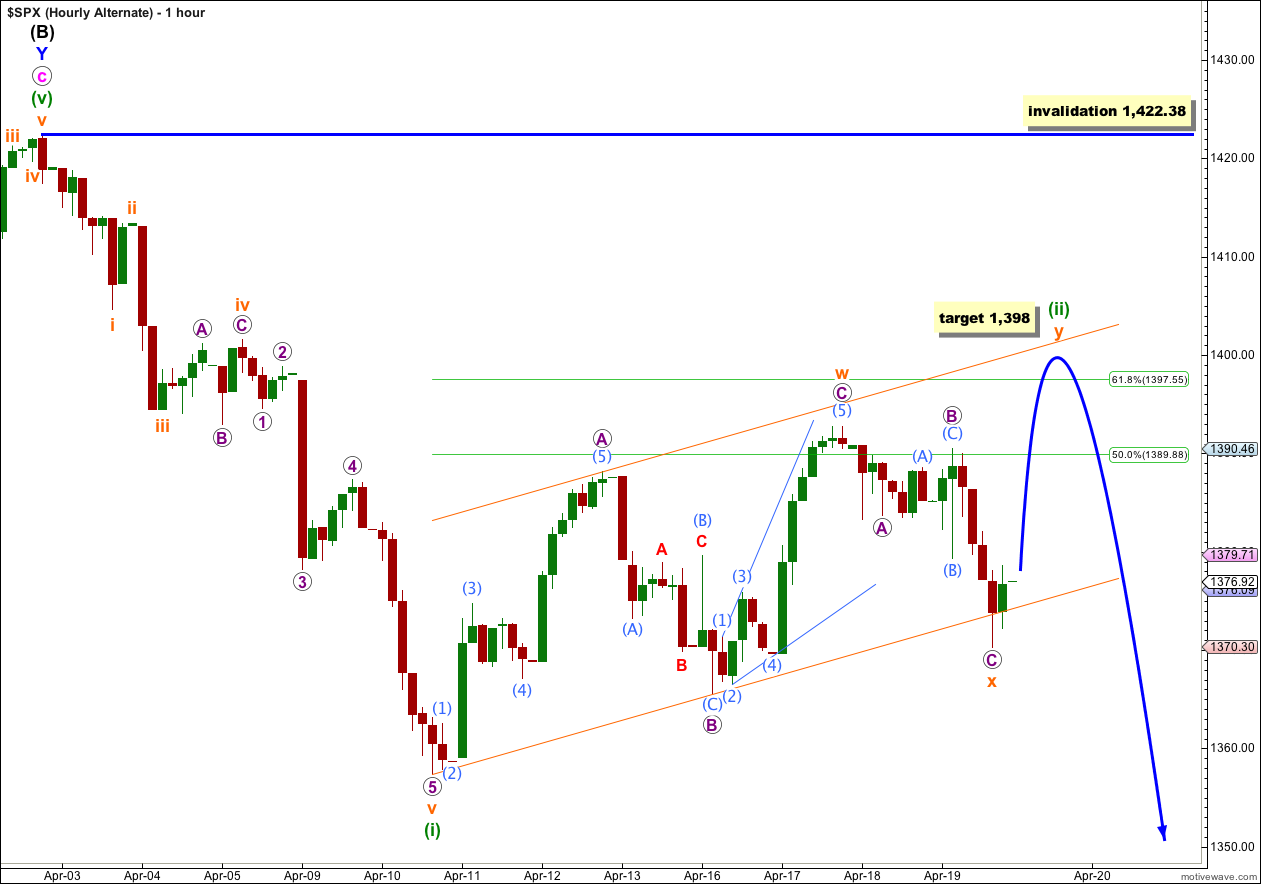
It remains possible that wave (ii) green may not be over and could continue further as a double zigzag or double combination correction.
Within the double, wave x orange (the three joining the two structures of the double) would now have to be complete.
If this wave count is correct we should see upwards and sideways movement for another two to three sessions as wave y orange unfolds. Wave y orange may be a zigzag, flat or triangle.
This wave count has a lower probability than the main hourly wave count because it sees wave (ii) green as disproportionately large in comparison to wave (i) green, and because on the daily chart wave (ii) green looks like a perfectly complete three supporting the main hourly wave count.
Wave (ii) green may not move beyond the start of wave (i) green. This wave count is invalidated with movement above 1,422.38.
Alternate Daily Wave Count.
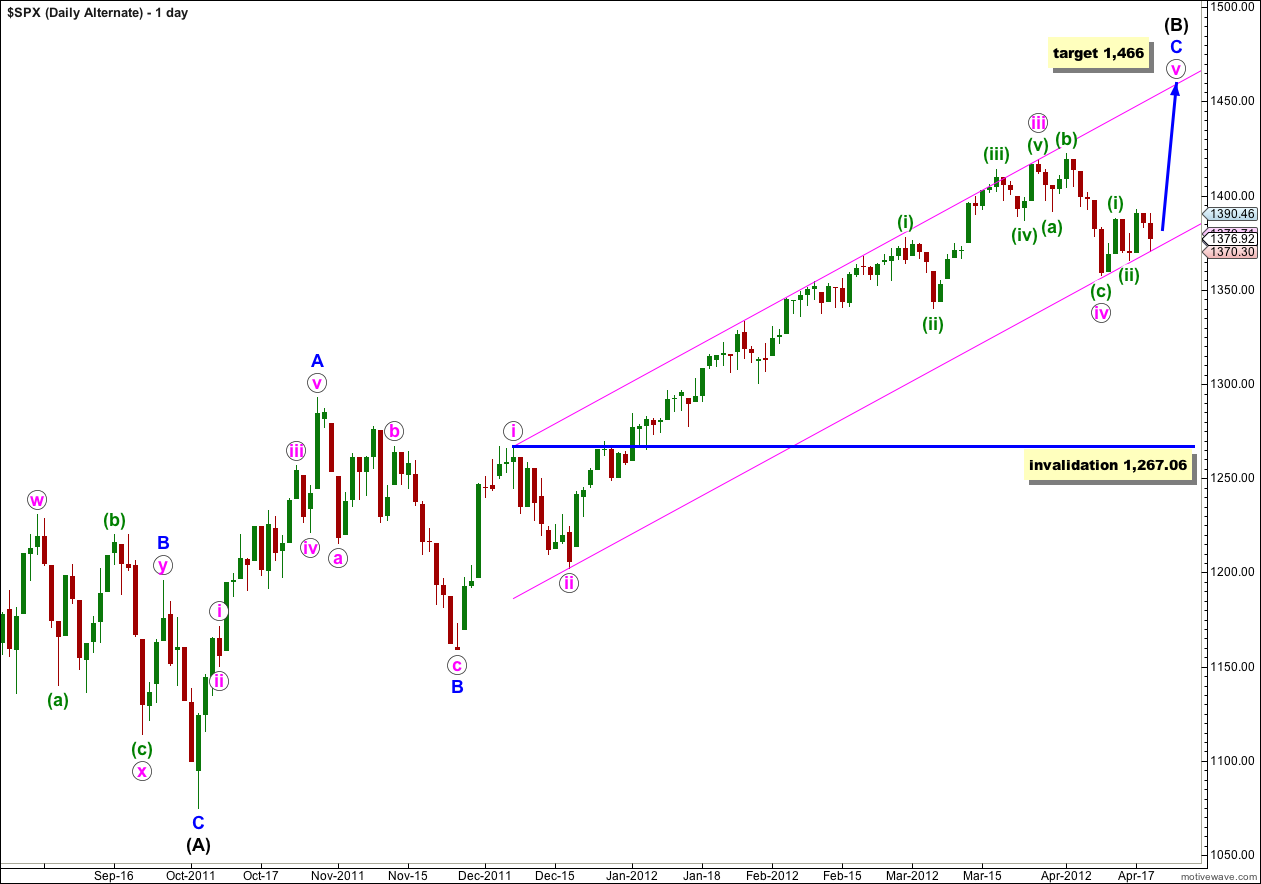
With price firmly within the parallel channel about wave C blue this wave count looks correct as far as the trend channel goes, but its subdivisions don’t fit as well as the main wave count and it still has a slightly lower probability. With price again finding strong support at the lower edge of this channel this wave count again looks suspiciously correct! We need to see this channel breached before we can discard this wave count. Until then we must accept the risk that we may yet see new highs.
If the upwards wave labeled A blue here subdivides into a five then wave (B) black may be a single zigzag structure. This wave count has a fairly low probability because this wave subdivides most easily into a three, and it is difficult (but possible) to see it as a five. As a five it has a strange looking third wave which reduces the probability of this wave count.
At 1,466 wave v pink would reach equality with wave i pink. Wave (B) black would be almost 138% the length of wave (A) black, the maximum common length for a B wave in relation to an A wave of a flat correction.
Wave iv pink may not move into wave i pink price territory. This wave count is invalidated with movement below 1,267.06. However, in practice I would discard this wave count before price gets that low, as a strong and significant breach of the parallel channel containing wave C blue would reduce the probability of this wave count.
Looks like your (Alternate Daily Wave Count) “At 1,466 wave v pink would reach equality with wave i pink.” Could be right on target with the channel holding very well this week.
With Wave-1 in the 1414.00