
Yesterday’s analysis expected upwards movement, but the small degree correction continued to move price lower. The wave count remains valid.
I have a main wave count which I consider the most likely scenario, and am expecting the trend to continue further yet towards targets calculated.
Today I have an alternate daily wave count which may be used if the main wave count is invalidated.
Click on the charts below to enlarge.
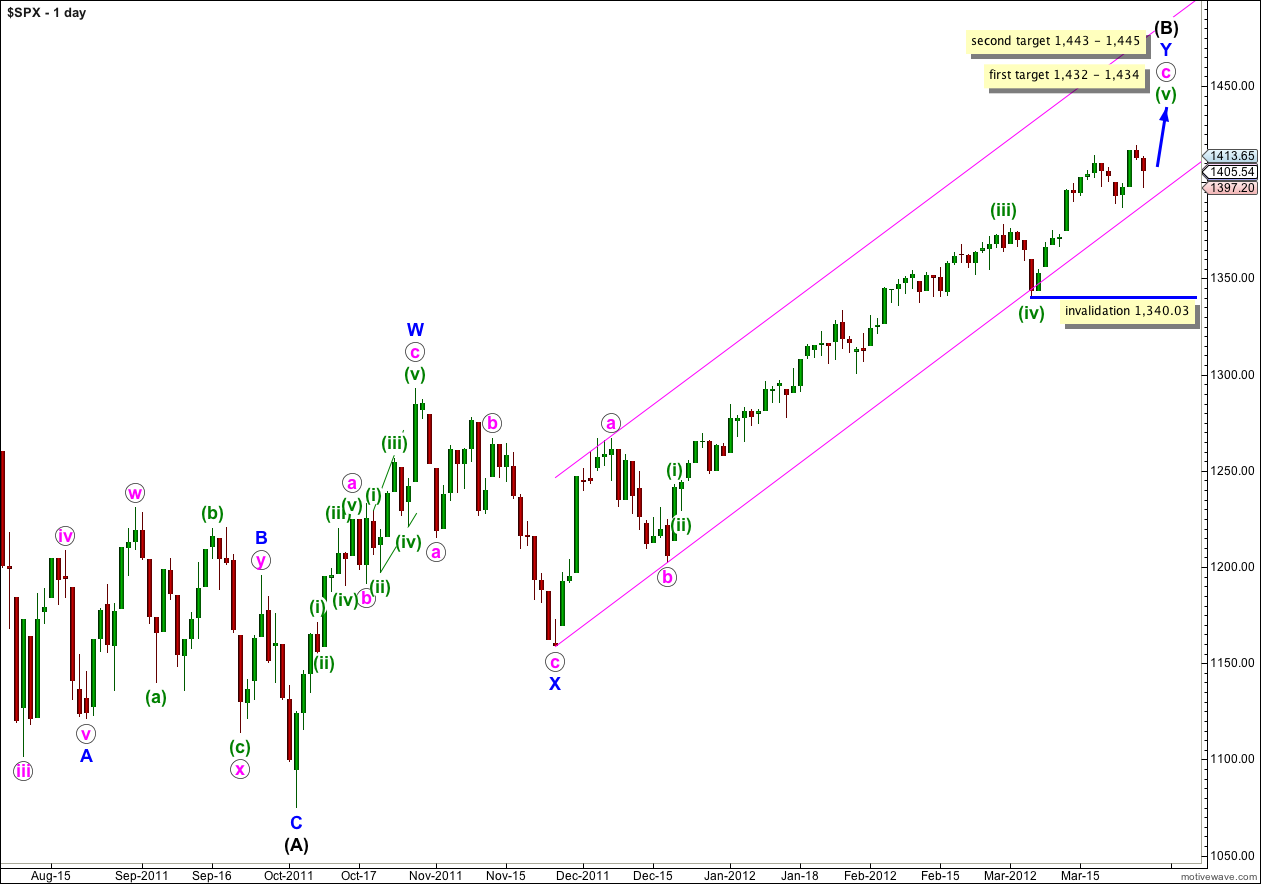
This wave count sees the S&P 500 as within a final fifth wave upwards to complete a large correction at intermediate (black) degree. If wave Y blue is to have a Fibonacci time relationship then it may take another 5 sessions to complete, lasting a Fibonacci 89 days. Please note though that Fibonacci time relationships are not as reliable as price ratios, and this expectation of another 5 sessions is a rough guide only.
Wave (B) black is correcting the three wave structure of wave (A) black within a flat correction at primary degree. The maximum common length for wave (B) black in relation to wave (A) black is 138%. This would be achieved at 1,464 and it is likely we shall see a trend change before this price point is reached.
At 1,432 wave (v) green would reach 0.618 the length of wave (iii) green. At 1,434 wave v orange within wave (v) green would reach equality with wave iii orange. This is our first target for upwards movement to end.
If price continues through the first target, and the structure requires further upwards movement to complete it, the second target is at 1,445 where wave (v) green would reach 2.618 the length of wave (i) green. At 1,443 wave v orange within wave (v) green would reach 1.618 the length of wave i orange. This gives us a second two point target zone.
Within wave (v) green no second wave correction may move beyond the start of the first wave. This wave count is invalidated with movement below 1,340.03.
We should keep drawing the parallel channel on the daily chart about the zigzag of wave Y blue. Draw the first trend line from the start of Y blue to the low labeled b pink, then place a parallel copy on the high of a pink. Only when this channel is breached by a full daily candlestick below it shall we have confirmation of a big trend change, and until that time we should expect upwards movement to continue.
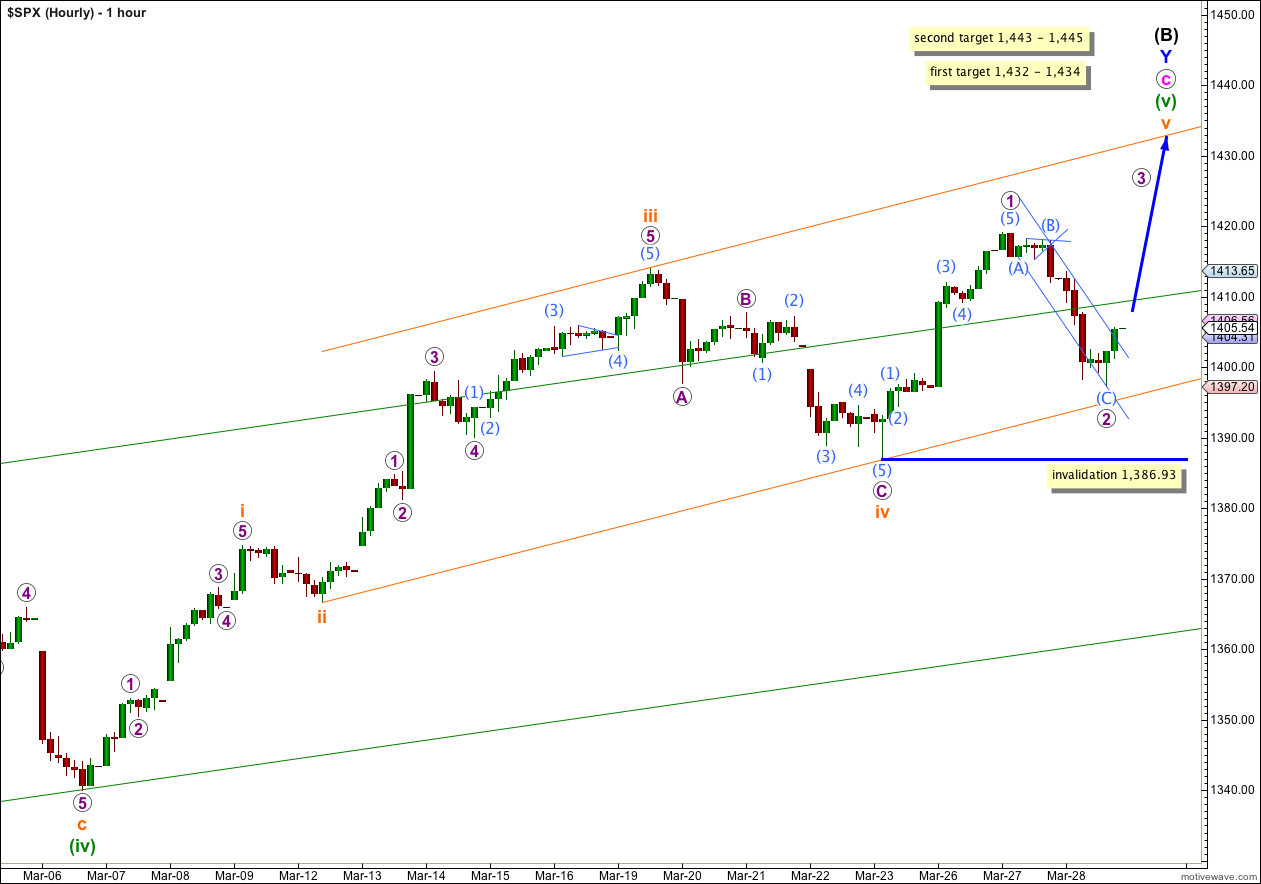
Wave 2 purple has extended lower which was not what last analysis had expected as most likely.
With some upwards movement at the end of Wednesday’s session it looks like the zigzag for wave 2 purple is likely to be over. There is no Fibonacci ratio between waves (A) and (C) aqua now, but with wave (B) as a triangle wave (C) aqua now subdivides into a perfect five wave impulse on the 5 minute chart.
I have drawn a best fit parallel channel about the zigzag for 2 purple. At the end of Wednesday’s session this channel was slightly breached. If the breach continues at the beginning of Thursday’s session then it is likely wave 2 purple is over and wave 3 purple upwards is underway.
Wave 2 purple is now just over the 0.618 retracement level of wave 1 purple, which is a typical place for second waves to end.
Wave 3 purple would reach equality with wave 1 purple at 1,429. This target fits with both of our longer term targets for (B) black to end.
Wave 3 purple would reach 1.618 the length of wave 1 purple at 1,449. This target does not fit with either of our long term targets which would need to be recalculated.
Any further extension lower of wave 2 purple may not move beyond the start of wave 1 purple. This wave count is invalidated with movement below 1,386.93.
If this wave count is invalidated by downwards movement there will be a possibility that wave (B) black is over and the S&P 500 has had a major trend change. However, I would wait for confirmation of this trend change by a breach of the parallel channel on the daily chart before calling a high in place and calculating downwards targets.
Alternate Daily Wave Count.
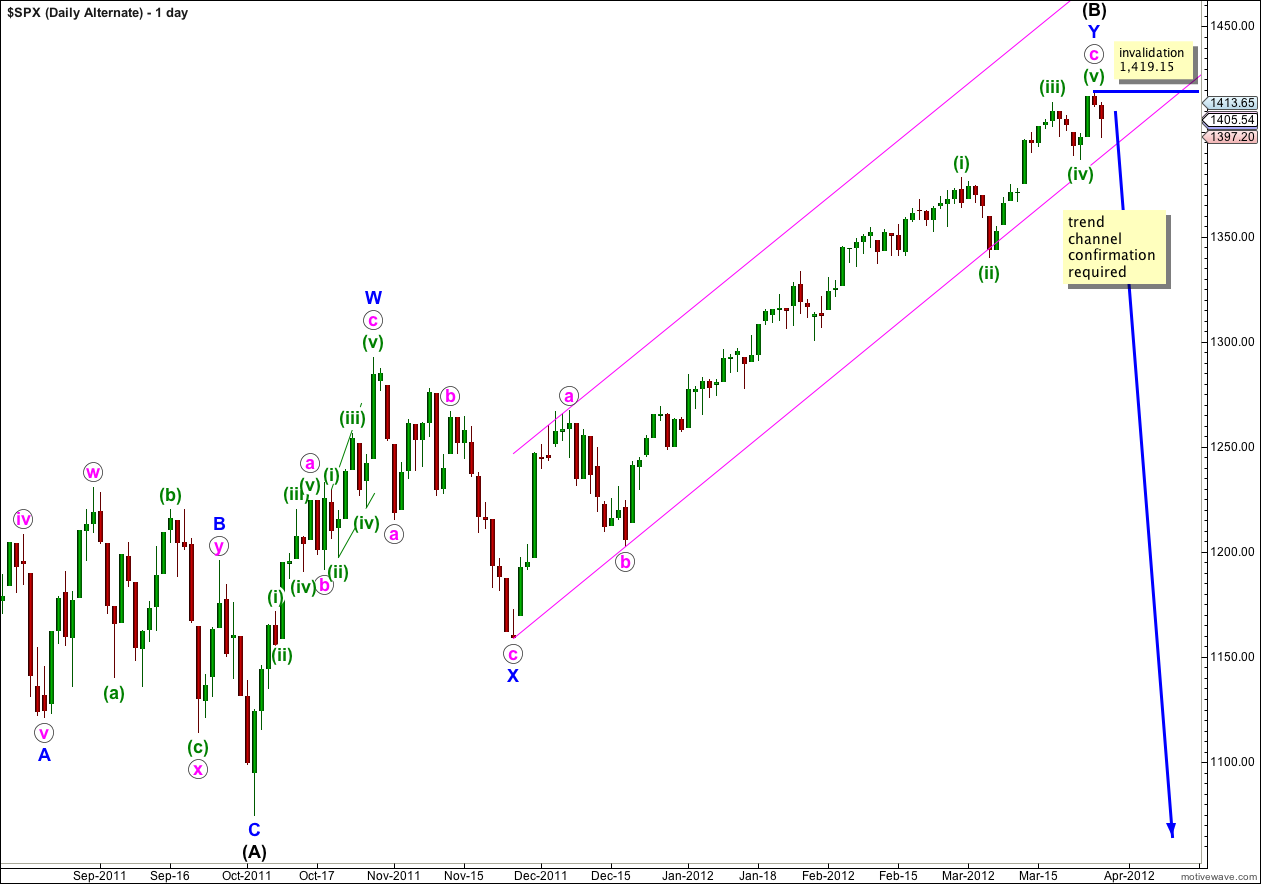
It is possible that wave (B) black is over. Upwards movement for wave Y blue zigzag has now a count of 7 on the daily chart which is corrective.
However, this wave count would only be used if we see movement below 1,386.93. Thereafter, we would need trend channel confirmation of a trend change with a full daily candlestick below the pink channel here on the daily chart.
If wave (B) black is over then there is no Fibonacci ratio between waves W and Y blue.
Within wave Y blue there is no Fibonacci ratio between waves a and c pink.
Ratios within wave c pink are: wave (iii) green is 6.86 points longer than 0.382 the length of wave (i) green, and wave (v) green is 3.96 points longer than 0.382 the length of wave (iii) green.
Any movement above 1,419.15 would invalidate this wave count.