
As expected from our main wave count the S&P 500 has moved higher today. We should expect the main trend to continue towards our targets.
The alternate hourly chart is looking less likely today. I will keep the possibility in mind, and if it shows itself to be correct will publish it again. At this stage though the main wave count has a significantly higher probability and I’ll use just the one chart for us.
We still have just the one daily wave count.
Click on the charts below to enlarge.
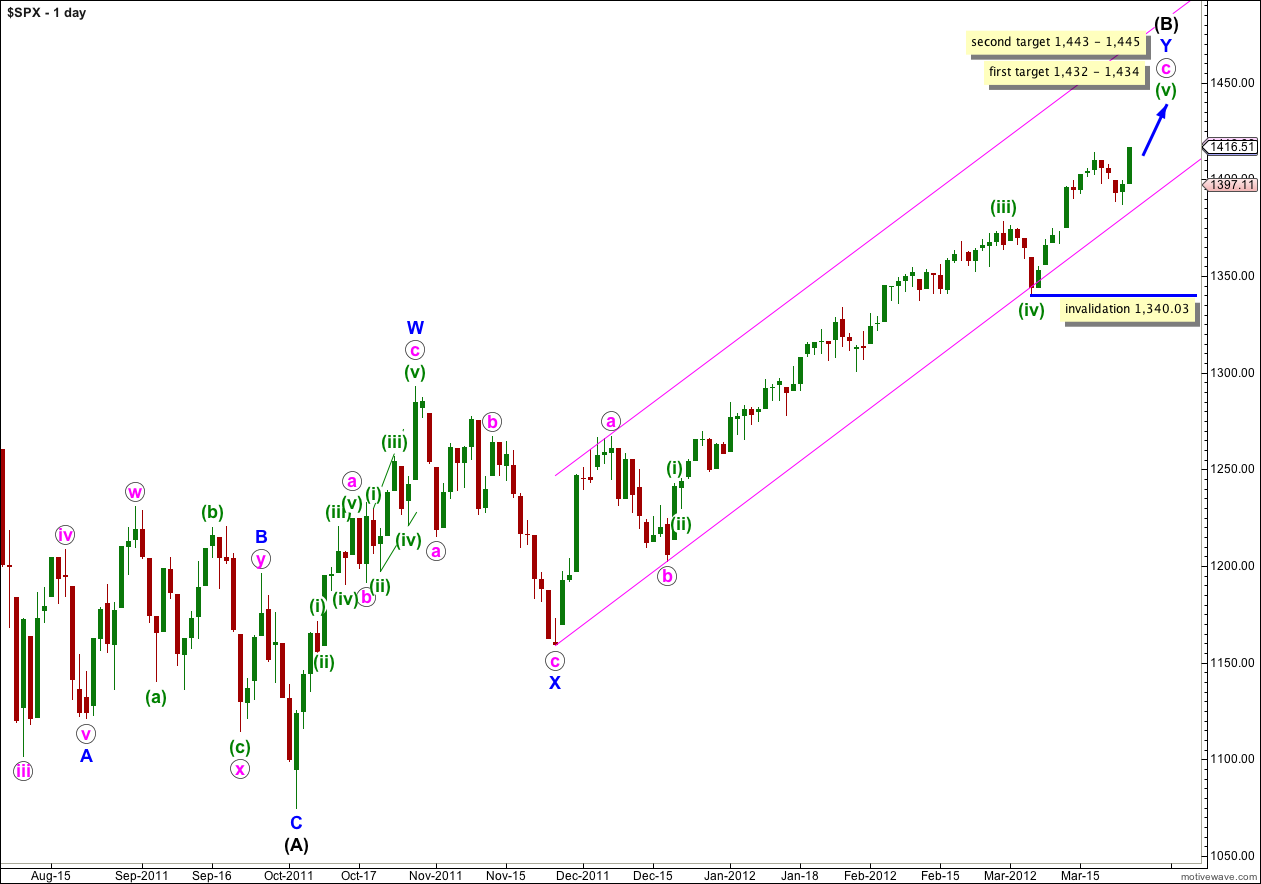
This wave count sees the S&P 500 as within a final fifth wave upwards to complete a large correction at intermediate (black) degree. If wave Y blue is to have a Fibonacci time relationship then it may take another 7 sessions to complete, lasting a Fibonacci 89 days. Please note though that Fibonacci time relationships are not as reliable as price ratios, and this expectation of another 7 sessions is a rough guide only.
Wave (B) black is correcting the three wave structure of wave (A) black within a flat correction at primary degree. The maximum common length for wave (B) black in relation to wave (A) black is 138%. This would be achieved at 1,464 and it is likely we shall see a trend change before this price point is reached.
At 1,432 wave (v) green would reach 0.618 the length of wave (iii) green. At 1,434 wave v orange within wave (v) green would reach equality with wave iii orange. This is our first target for upwards movement to end.
If price continues through the first target, and the structure requires further upwards movement to complete it, the second target is at 1,445 where wave (v) green would reach 2.618 the length of wave (i) green. At 1,443 wave v orange within wave (v) green would reach 1.618 the length of wave i orange. This gives us a second two point target zone.
Within wave (v) green no second wave correction may move beyond the start of the first wave. This wave count is invalidated with movement below 1,340.03.
We should keep drawing the parallel channel on the daily chart about the zigzag of wave Y blue. Draw the first trend line from the start of Y blue to the low labeled b pink, then place a parallel copy on the high of a pink. Only when this channel is breached by a full daily candlestick below it shall we have confirmation of a big trend change, and until that time we should expect upwards movement to continue.
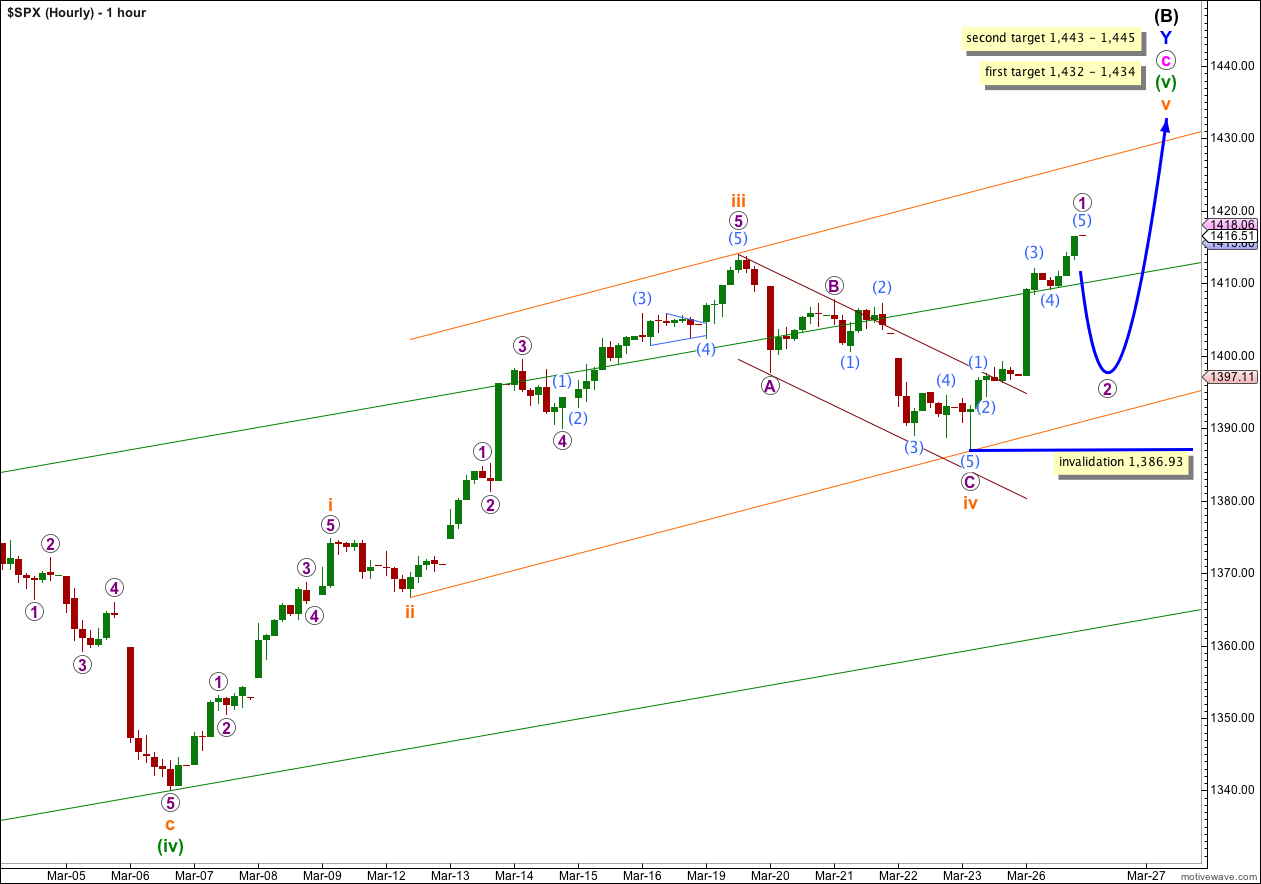
Upwards movement for Monday’s session is so far a clear five wave impulse. This structure may be complete and we may see a small degree second wave correction, which should be over early in the session, before a small degree third wave up.
Ratios within wave 1 purple are: wave (3) aqua is 1.45 points longer than 1.618 the length of wave (1) aqua, and wave (5) aqua is 0.66 longer than 0.382 the length of wave (3) aqua.
Wave 2 purple may be a deep correction, but it does not have to be. It may not move beyond the start of wave 1 purple. This wave count is invalidated with movement below 1,386.93.
It looks like wave v orange may end about the upper edge of the orange parallel channel, rather than midway. Draw this channel with the first trend line from the lows of ii to iv orange, then place a parallel copy on the high of iii orange.