
Yesterday’s analysis expected the S&P 500 to move lower today, and our target was about 1,384. Price has fallen about 5 points short of our target, thus far.
We will use trend channels to indicate when this small correction is over.
Again we have only one daily and one hourly chart today.
Click on the charts below to enlarge.
Now that there is more movement to analyse, making the structure most likely complete, I can now refine the targets for this wave to end.
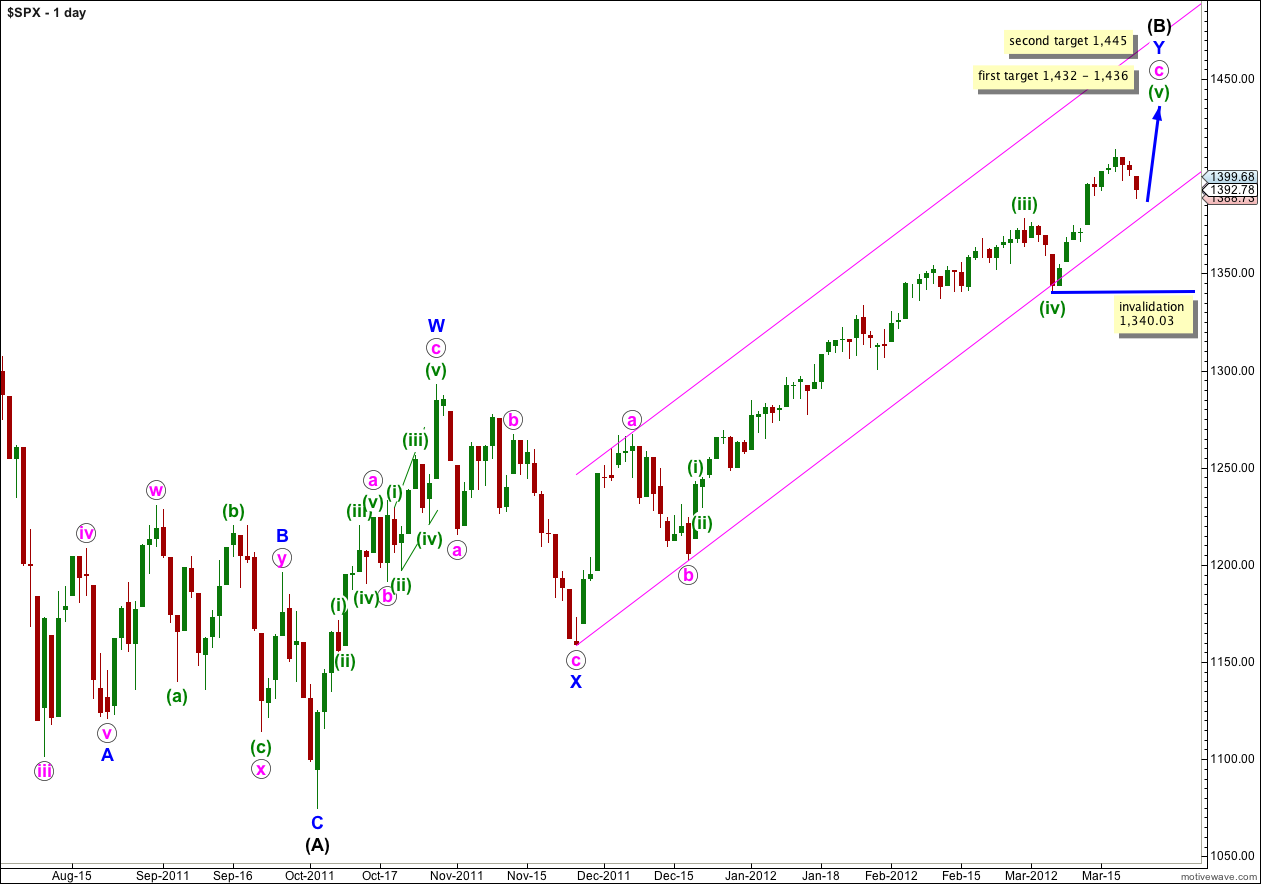
This wave count sees the S&P 500 as within a final fifth wave upwards to complete a large correction at intermediate (black) degree. If wave Y blue is to have a Fibonacci time relationship then it may take another 9 sessions to complete, lasting a Fibonacci 89 days. Please note though that Fibonacci time relationships are not as reliable as price ratios, and this expectation of another 9 sessions is a rough guide only.
Wave (B) black is correcting the three wave structure of wave (A) black within a flat correction at primary degree. The maximum common length for wave (B) black in relation to wave (A) black is 138%. This would be achieved at 1,464 and it is likely we shall see a trend change before this price point is reached.
At 1,432 wave (v) green would reach 0.618 the length of wave (iii) green. At 1,436 wave v orange within wave (v) green would reach equality with wave iii orange. This is our first target for upwards movement to end.
If price continues through the first target, and the structure requires further upwards movement to complete it, the second target is at 1,445 where wave (v) green would reach 2.618 the length of wave (i) green. Also at 1,445 wave v orange within wave (v) green would reach 1.618 the length of wave iii orange.
Within wave (v) green no second wave correction may move beyond the start of the first wave. This wave count is invalidated with movement below 1,340.03.
We should keep drawing the parallel channel on the daily chart about the zigzag of wave Y blue. Draw the first trend line from the start of Y blue to the low labeled b pink, then place a parallel copy on the high of a pink. Only when this channel is breached by a full daily candlestick below it shall we have confirmation of a big trend change, and until that time we should expect upwards movement to continue.
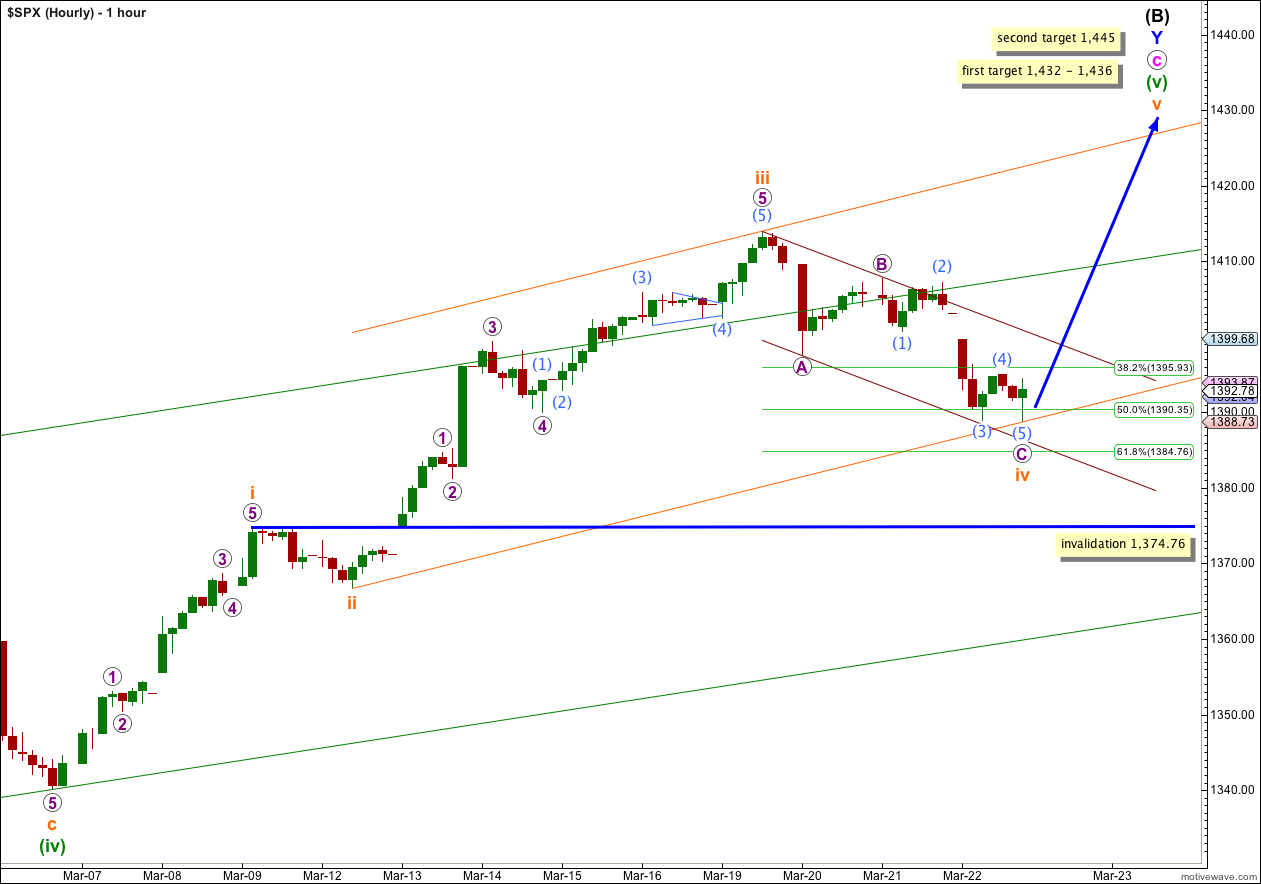
We did not get the small amount of upwards movement to start Thursday’s session that I was anticipating, but we did get a clear C wave downwards.
My analysis of wave B purple was wrong yesterday. With B purple over at 1,407.75 wave C purple downwards is now a very clear five wave structure.
Ratios within wave C purple are: wave (3) aqua is just 0.32 short of 2.618 the length of (1) aqua, and wave (5) aqua does not have an adequate Fibonacci ratio to either (1) or (3) aqua.
No matter how the structure for wave iv orange is labeled it has a corrective count of 7 and it is highly likely that it is over here. There is alternation in depth of correction with wave ii orange shallow and wave iv orange deep, but not in structure as they both are zigzags. Wave iv orange is longer lasting and disproportionate to wave ii orange, but it does not look too strange. If it were to continue as a double zigzag or combination it would not have the “right look”, and it is most likely over here.
Both of our targets for wave v orange have a good probability, and I consider the probability about even at this stage.
We may use Elliott’s technique to draw a small channel about wave iv orange. When this channel is breached by upwards movement that will be some confirmation that wave iv orange is over and the next wave upwards has begun. This is the smaller purple channel.
We may also use Elliott’s technique to draw a new channel about wave (v) green. Draw the first trend line from the lows of ii to iv orange, then place a parallel copy on the high of iii orange. Wave v orange may end either midway in this orange channel (more likely) or it may end about the upper edge of the channel (less likely). This is the orange channel.
If wave iv orange does continue further it may not move into wave i orange price territory. This wave count is invalidated with movement below 1,374.76.