
The S&P 500 moved slightly higher, which was expected after last analysis, and then completed a small three wave correction downwards.
The short term target has been recalculated now that there is more structure to analyse. The new target has a high probability.
The longer term targets remain the same.
Click on the charts below to enlarge.
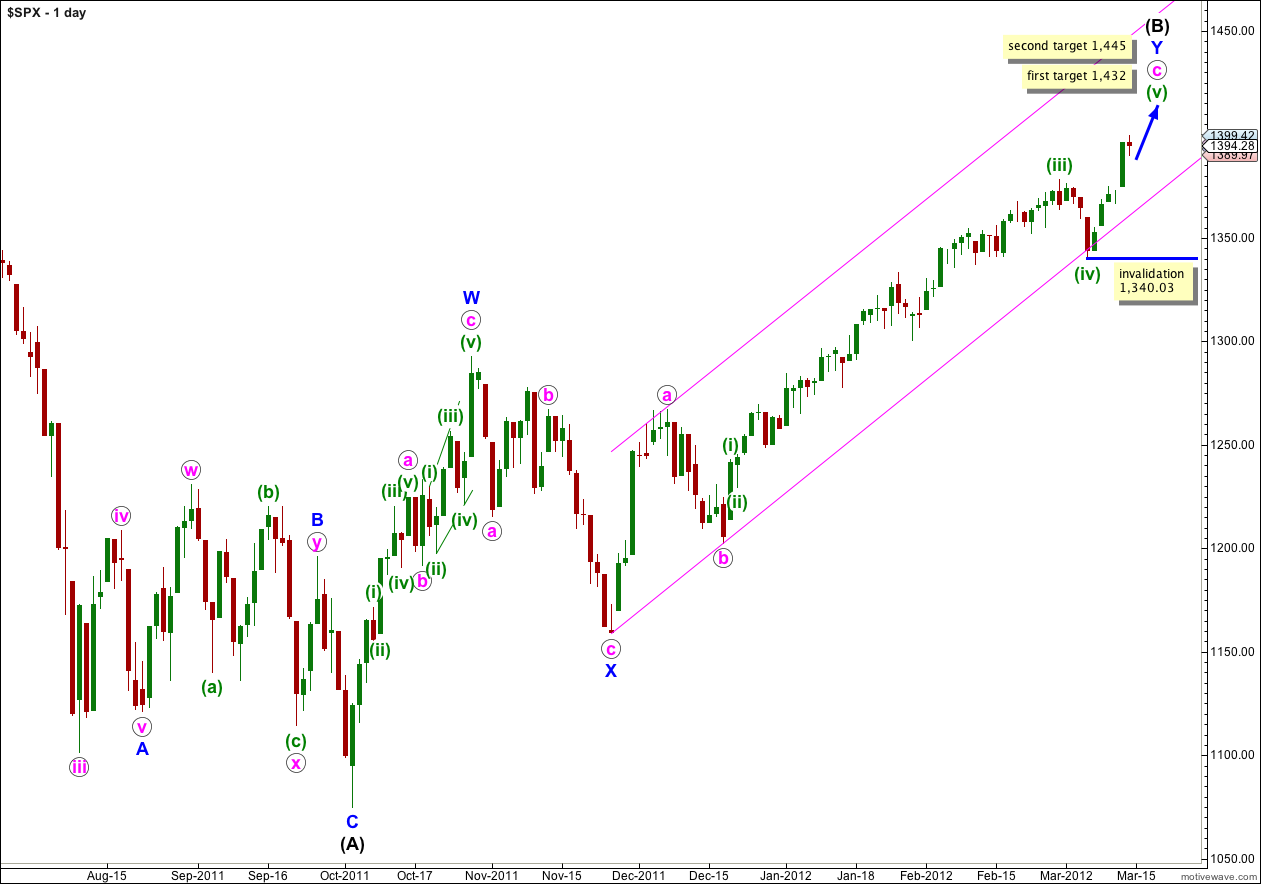
This main wave count, and our alternate below, both see the S&P 500 as within a final fifth wave upwards to complete a large correction at intermediate (black) degree. This final wave may take about another three weeks to complete.
Wave (B) black is correcting the three wave structure of wave (A) black within a flat correction. The maximum common length for wave (B) black in relation to wave (A) black is 138%. This would be achieved at 1,464 and it is likely we shall see a trend change before this price point is reached.
At 1,432 wave (v) green would reach 0.618 the length of wave (iii) green. This is our first target for upwards movement to end.
If price continues through the first target, and the structure requires further upwards movement to complete it, the second target is at 1,445 where wave (v) green would reach 2.618 the length of wave (i) green.
Within wave (v) green no second wave correction may move beyond the start of the first wave. This wave count is invalidated with movement below 1,340.03.
Upwards movement found resistance about the upper edge of this parallel channel containing wave c pink. Draw this channel first with a trend line from the lows of (ii) to (iv) green, then place a parallel copy on the high of (iii) green. This channel should continue to be useful for another few weeks.
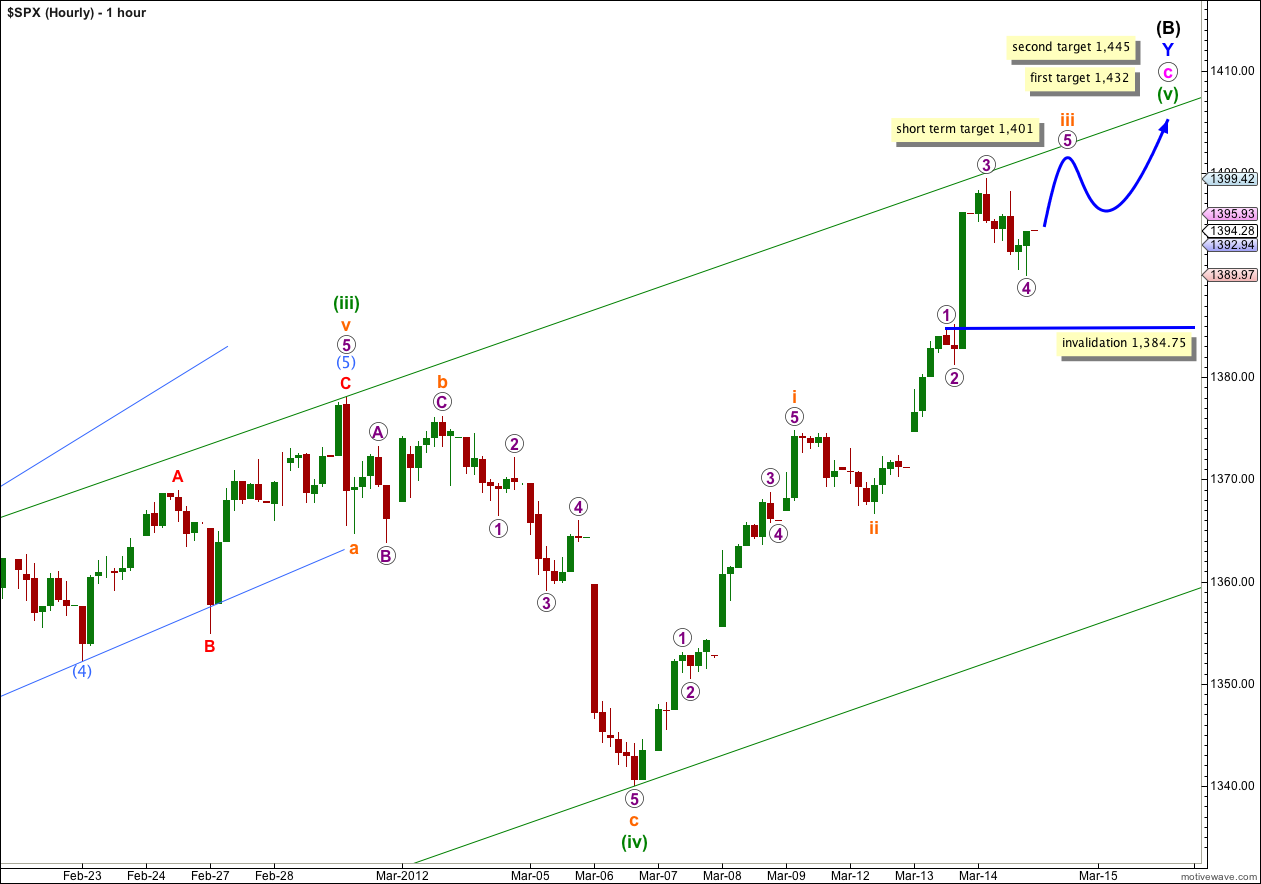
Wave 3 purple moved slightly higher to end just 0.13 points longer than equality with wave 1 purple. At 1,401 wave 5 purple would reach 0.618 the length of wave 3 purple. Also at 1,401 wave iii orange would reach equality with wave i orange. Because this target is the same for two wave degrees it has a reasonable probability.
Downwards movement during Wednesday’s session is in a clear three wave movement and is probably wave 4 purple complete. However, if wave 4 purple continues further as a double or a triangle then it may not move into wave 1 purple price territory. This wave count is invalidated with movement below 1,384.75.
When wave 5 purple completes wave iii orange then we must move the invalidation point down to the high of i orange at 1,374.76. The subsequent fourth wave correction may not move into wave i orange price territory.
Expect wave 5 purple to end wave iii orange about the upper green trend line.
Alternate Daily Wave Count.
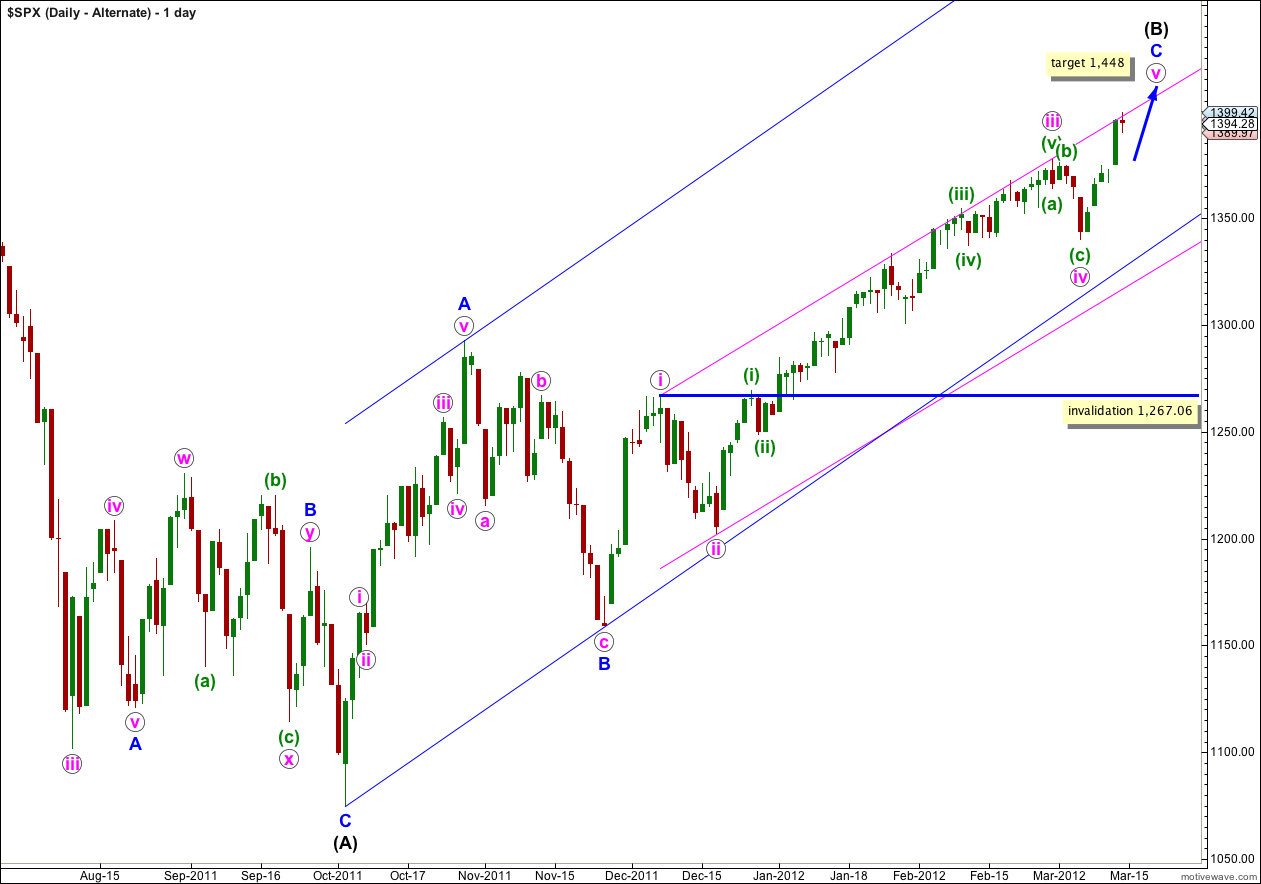
This alternate wave count also sees downwards movement from last week as a fourth wave correction.
Within this wave count wave iii pink is just 0.28 points longer than 1.618 the length of wave i pink. Wave i pink is 108.4 points in length and wave iii pink is 175.67 points in length, and this difference of 0.28 points is extremely small. It is almost a perfect Fibonacci ratio. This adds slight weight to this wave count, or at least to this portion of it.
However, this alternate wave count still has a lower probability than the main wave count because the subdivision of wave A blue upwards is not as satisfactory. But at this stage it makes little difference, because they both expect upwards movement to complete a final fifth wave.
At 1,448 wave v pink would reach equality with wave i pink.
There will probably be no Fibonacci ratio between waves A and C blue within (B) black.
If wave iv pink extends any lower or further sideways as a double flat or double combination, then it may not move into wave i pink price territory. This wave count is invalidated with movement below 1,267.06.
Hey Lara,
Thank you… 1440.00 on the radar