
Yesterday’s main wave count expected downwards movement, which is very clearly what we have got. We may be only another very few sessions away from reasonable confirmation of a trend change. We shall use our parallel channel on the daily chart for this confirmation.
Today I have more confidence in our main wave count as wave behaviour seems to be unfolding nicely as the main wave count would expect.
Click on the charts below to enlarge.
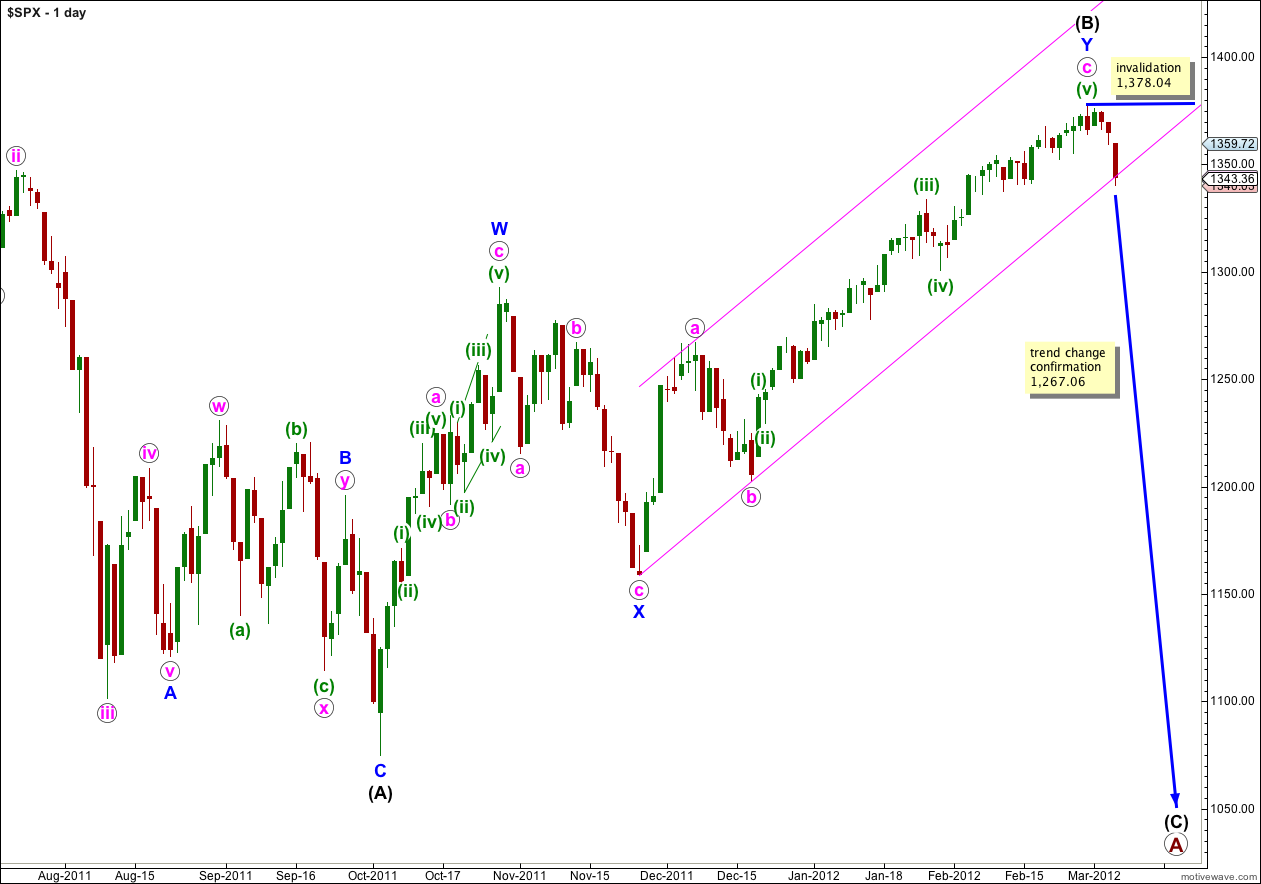
Price has moved strongly downwards to find some support about the lower edge of the parallel channel here on the daily chart. This may be where a small correction is initiated, and the following wave downwards should have the momentum to break through this channel. When we have a full daily candlestick below this pink parallel channel then I shall consider that confirmation of a large trend change. At that stage I will calculate a target for wave (C) black.
Primary wave A is an expanded flat correction: wave (A) black subdivides into a three and wave (B) black is over 105% the length of wave (A) black (it is 108%). This means we would expect wave (C) black to end substantially beyond the end of wave (A) black.
Movement below 1,267.06 would invalidate the alternate daily wave count and eventually provide us with full and final confirmation that the S&P 500 has had a major trend change. However, we don’t have to wait for this for a reasonable level of confidence in the new trend because the alternate daily wave count has a fairly low probability.
Main Hourly Wave Count.
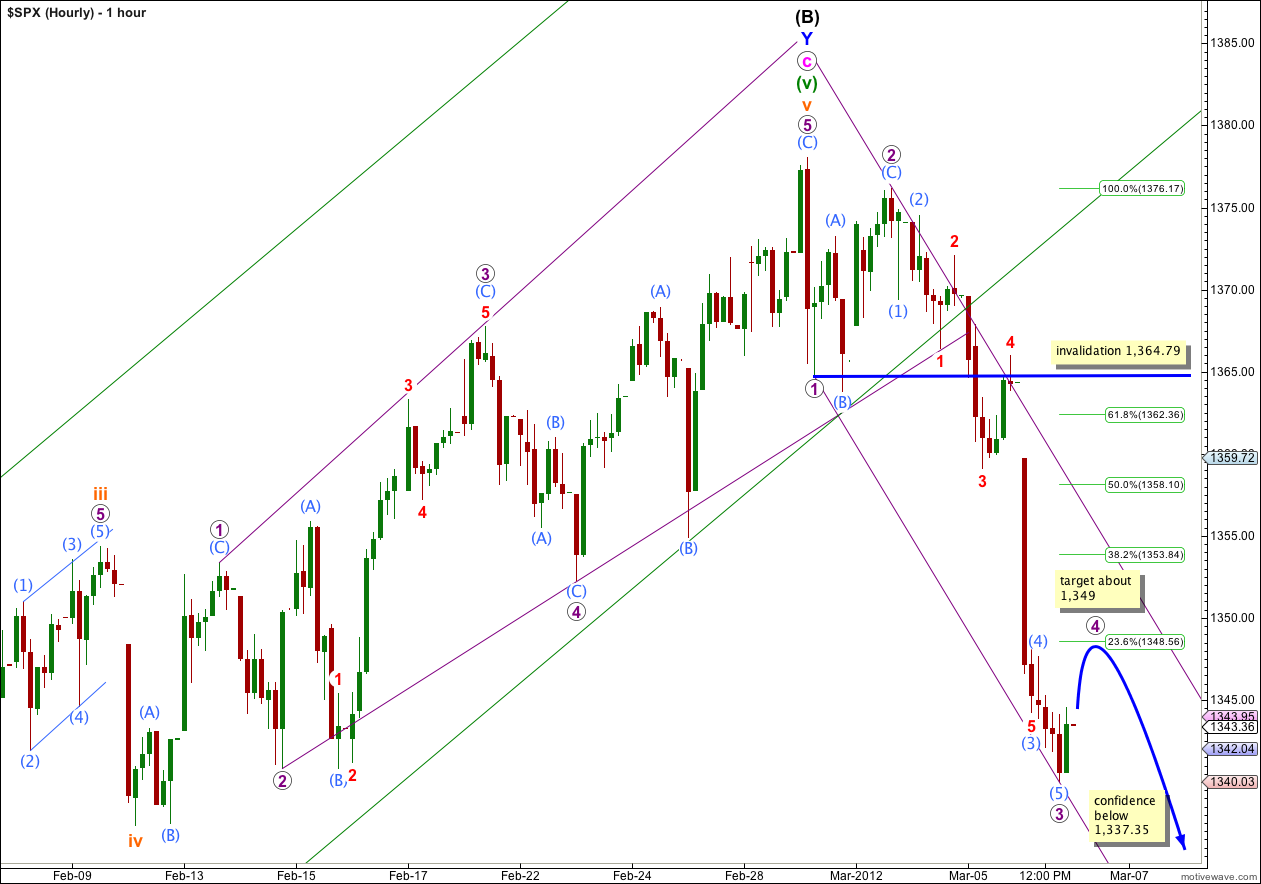
Within the first 5 minutes of market open our short term target at 1,355 was comfortably exceeded. Downwards movement has a very clear third wave look and there are some most excellent Fibonacci ratios here.
Wave 3 purple is 1.27 points longer than 2.618 the length of wave 1 purple.
Ratios within wave 3 purple are: wave (3) aqua is 1.5 points longer than 4.236 the length of wave (1) aqua, and wave (5) aqua is just 0.44 points longer than 0.236 the length of wave (3) aqua.
Ratios within wave (3) aqua are: wave 3 red is just 0.16 points short of 1.618 the length of wave 1 red, and wave 5 red is just 0.49 points longer than 2.618 the length of wave 1 red.
Wave 2 purple was a deep expanded flat correction of wave 1 purple. We may expect wave 4 purple to be a shallow zigzag, triangle, or combination (possibly also a flat). If wave 4 purple reaches only to 0.236 the length of wave 3 purple then it would also end about the fourth wave of one lesser degree, which is wave (4) aqua ending at 1,347.62. We may expect wave 4 purple to end about 1,349.
Wave 4 purple may not move into wave 1 purple price territory. This wave count is invalidated with movement above 1,364.79.
The following wave 5 purple downwards may be expected to be about 13.32 points in length if it is to reach equality with wave 1 purple.
Draw a parallel channel about this downwards movement. The first trend line is drawn from the lows of 1 to 3 purple and a parallel copy is placed upon the high of 2 purple. Expect wave 4 purple to remain contained within this channel and the following fifth wave downwards to most likely end midway within this channel.
When waves 4 and 5 purple are complete then we may have more confidence in this wave count. At that stage we would have a clear five down on the hourly chart as so far it is only three down which could possibly be corrective.
Movement below 1,337.35 would invalidate the hourly alternate wave count (below) and provide some further confidence in this main hourly wave count.
Alternate Hourly Wave Count.
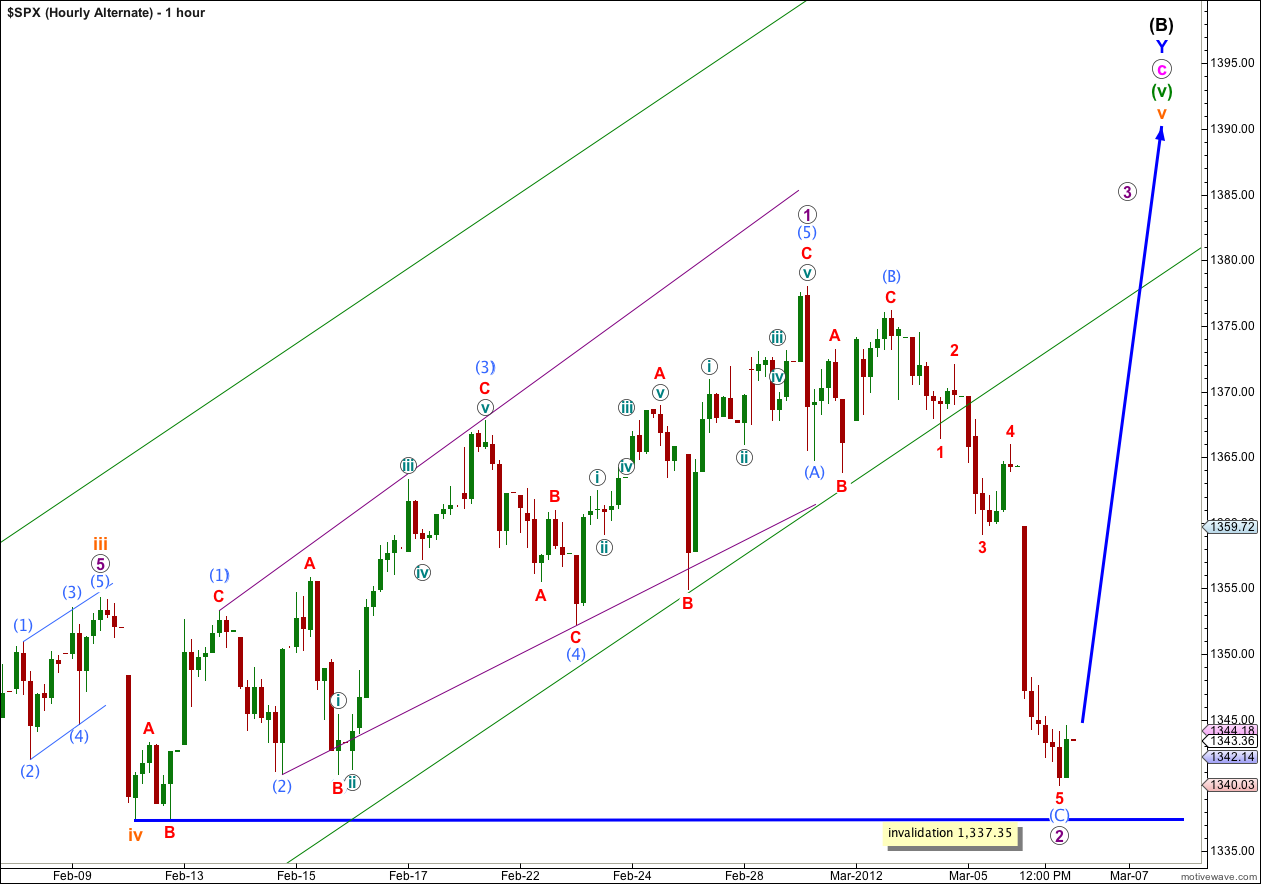
At this stage this alternate wave count looks very strange and unlikely. However, it is a possibility which we must consider while price is above 1,337.35.
The channel breach here on the hourly chart which yesterday looked pretty good, is today blindingly obvious. Price remained in this channel since it entered on 20th December last year, until two days ago. This channel breach is significant.
At this stage downwards movement is in a three wave structure and could be corrective. I expect that within a couple of days this wave count would be invalidated. Wave 2 purple may not move beyond the start of wave 1 purple. This wave count is invalidated with movement below 1,337.35.
Alternate Daily Wave Count.
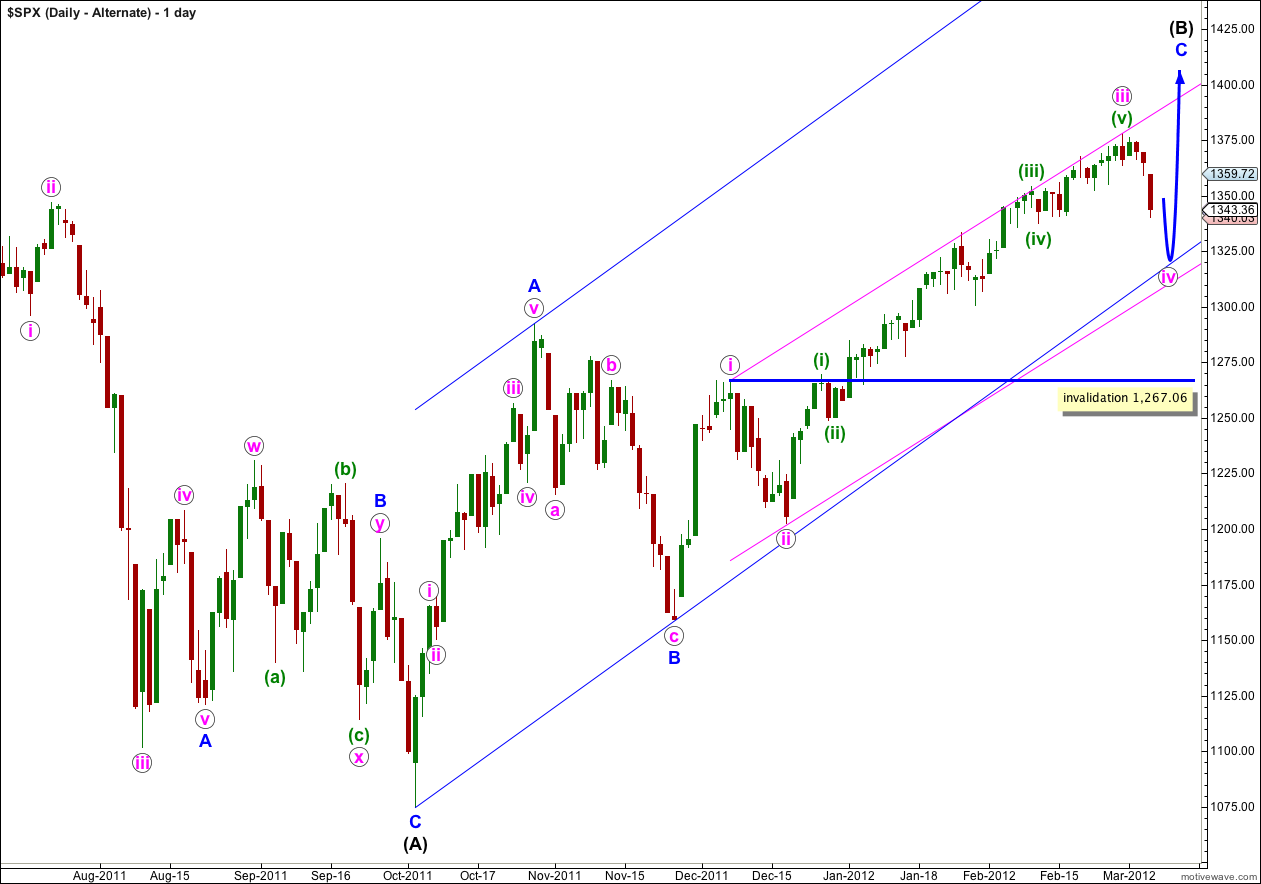
This alternate has a lower probability than the main daily wave count. If this wave count is correct then wave iv pink has just begun. I would expect it to last one to two weeks and be a relatively shallow correction of wave iii pink. It should look about equal in duration to wave ii pink. It should find support about the lower edge of this pink parallel channel drawn about the possible impulse of wave C blue.
If the upwards wave labeled here A blue was a five, and not a three, then wave (B) black is a single zigzag. Wave C blue is incomplete.
The subdivision of wave A blue as a five is not nearly as satisfactory as seeing it as a three, which the main wave count does. This is the reason why this alternate has a much lower probability.
Wave iv pink may not move into wave i pink price territory and this wave count is invalidated with movement below 1,267.06.
I am really only continuing to consider and publish this chart for you because of the important implication of a breach of 1,267.06. Eventually when we see movement below this point we can be certain that downwards movement is not just a fourth wave correction, and that the upwards trend must be over. At that stage we may have confidence that the S&P is likely to move to a new low below the end of (A) black at 1,074.77.
yes, please send a chart
admin@elliottwavestockmarket.com
in the daily count, is that possible we have a 1-5 movement instead WXY blue?? May I send you a chart?
That’s great Michael, thank you.
It’s always really nice and makes me happy to hear a member is happy with my work. It puts a smile on my face 🙂
Thanks again for the targets. They are very helpful in trading the edges. I appreciate your outstanding work.