
The S&P 500 has moved higher, closer to our target. The structure is still incomplete and we should expect this trend to continue.
Click on the charts below to enlarge.
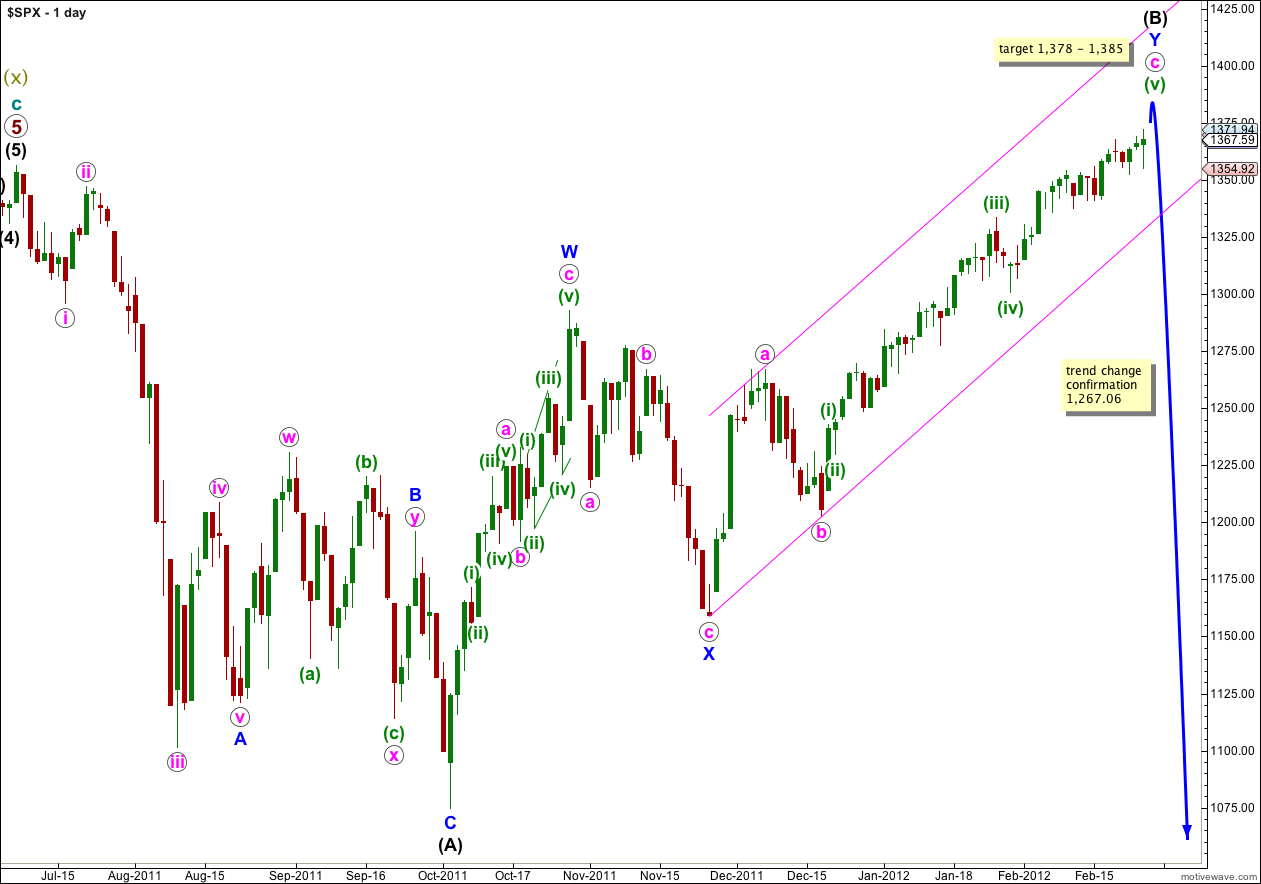
This main wave count follows on from our main historic monthly chart. It sees a flat correction at primary degree unfolding, and wave (B) black within that flat correction is probably within its last upwards wave and may end within the next 2 to 4 weeks (about).
Waves a and b pink within wave Y blue lasted a Fibonacci 8 days. Wave c pink is much longer, so far at 45 days. The next number in the Fibonacci sequence is 55, and wave c pink could possibly last another 10 trading days ending on the 9th of March, 2012 (give or take one day either side of this date). Please be aware this is a rough guideline only. While Fibonacci price ratios are commonly seen, Fibonacci time relationships are less reliable.
Wave (B) black is here labeled as a double zigzag, which is a relatively common structure. When the second zigzag labeled wave Y blue is complete the probability that wave (B) black is complete will be very high indeed. The only wave wave (B) black could continue further would be as a rare triple zigzag and the rarity of this structure means it has a very low probability.
Wave (B) black may move beyond the start of wave (A) black, and in fact for flat corrections this is most common. The maximum common length of B in relation to A within a flat is 138%. This would be achieved at 1,459. It is likely we shall see a trend change before this price point.
We may use Elliott’s channeling technique to draw a channel about wave Y blue. When this channel is breached by a full daily candlestick below it then we shall have strong confirmation of a trend change.
Wave (C) black is extremely likely to take price below the end of wave (A) black at 1,074.77.
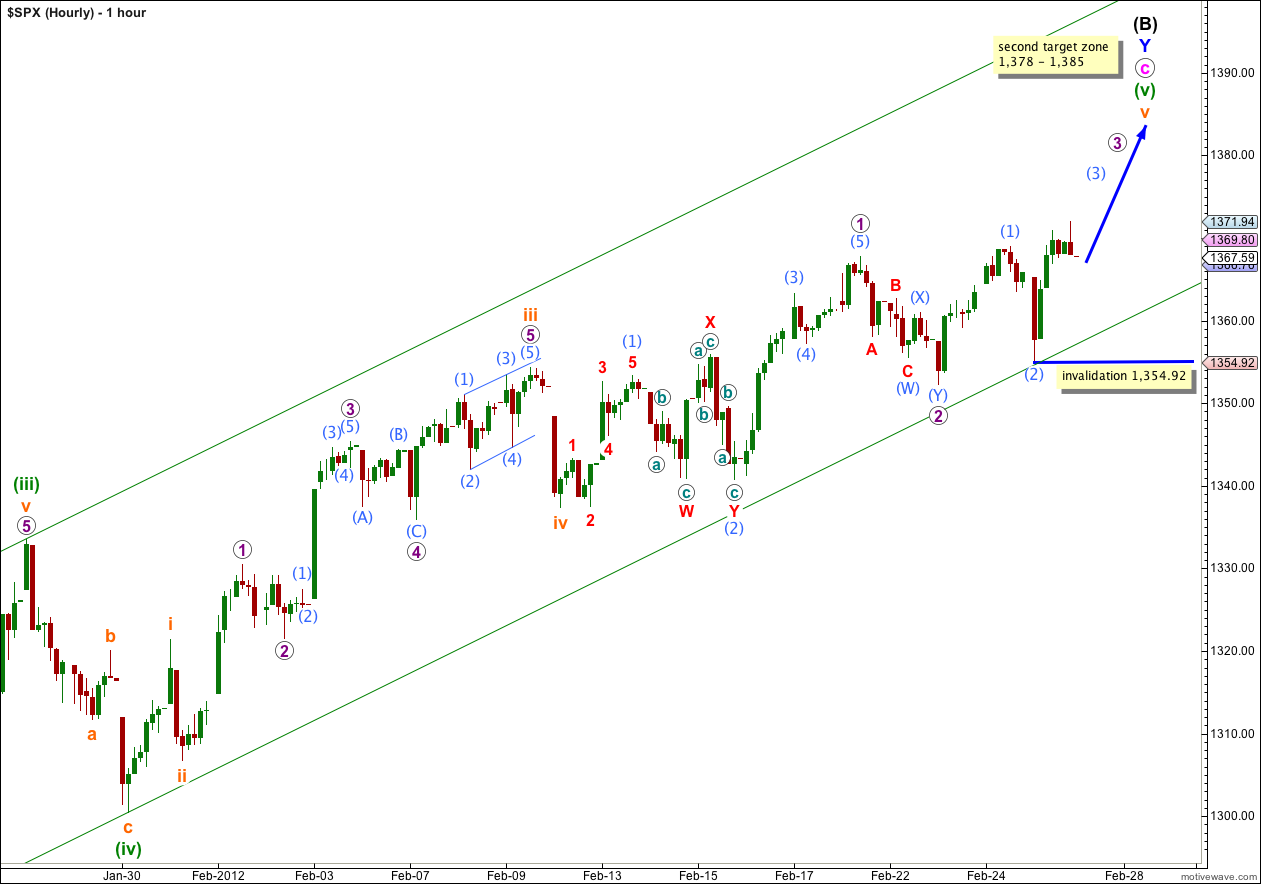
My last analysis of the piece of upwards movement labeled (1) aqua was incorrect and was quickly invalidated by movement below 1,362.46.
Downwards movement found strong support at the lower edge of the parallel channel. Draw this channel first with a trend line from the lows of (ii) to (iv) green, then place a parallel copy upon the high of (iii) green. This channel should continue to be useful to us.
I have considered an ending diagonal in this fifth wave position for v orange. The subdivisions could be seen to be unfolding correctly, but the wave lengths do not work. Therefore, wave v orange is most likely unfolding as a simple impulse.
So far only waves 1 and 2 purple within v orange are complete. Wave 3 purple is incomplete.
If this labeling is correct then we should see continuing strong upwards movement tomorrow as a third wave completes.
At 1,378 wave c pink would reach 1.618 the length of wave a pink. At 1,385 wave v orange would reach equality in length with wave iii orange. At this stage I favour the upper end of this target zone.
When waves 3 and 4 purple within wave v orange are complete then I can use Fibonacci ratios between purple waves to refine and reduce this target zone.
Within wave (3) aqua of wave 3 purple no second wave correction may move beyond the start of its first wave. This wave count is invalidated with movement below 1,354.92.
Alternate Daily Wave Count.
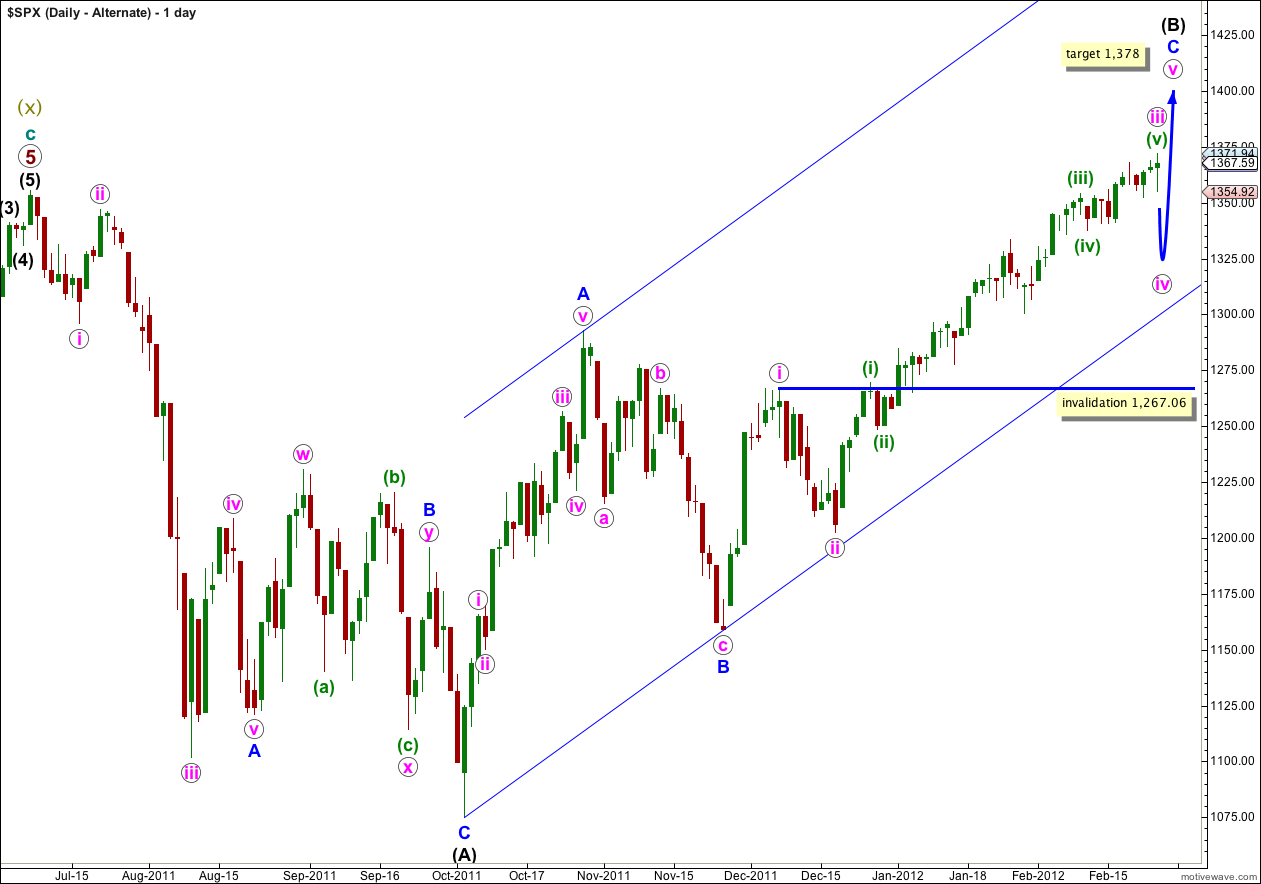
This alternate has a lower probability than the main daily chart.
If the upwards wave labeled here A blue was a five, and not a three, then wave (B) black is a single zigzag. Wave C blue is incomplete.
The subdivision of wave A blue as a five is not nearly as satisfactory as seeing it as a three, which the main wave count does. This is the reason why this alternate has a much lower probability.
It looks increasingly like wave iii pink would be incomplete. When wave iv pink begins we would expect it to last one to two weeks and be a relatively shallow correction of wave iii pink. It should look about equal in duration to wave ii pink.
Wave iv pink may not move into wave i pink price territory and this wave count is invalidated with movement below 1,267.06.
Nice call Lara!
On the edge a bit more for me… throw-over ending diagonal triangle or into 3-9 we go.
if your final target for B Black is 1378-1385, I would think that at least 3 purple should be complete, then go down to 4 purple and back up to 5 purble on 1378-1385 range. What is ur target for 3 purple?