
The S&P 500 has moved lower to start the session and then it moved higher thereafter. However, it has yet to make a new high above 1,367.76 and both our our hourly wave counts remain valid. We can look at the structure of Thursday’s movement on a 5 minute chart to get more information as to which of our wave counts has a higher probability. I favour the main hourly wave count more strongly than I did yesterday with this new information.
Click on the charts below to enlarge.
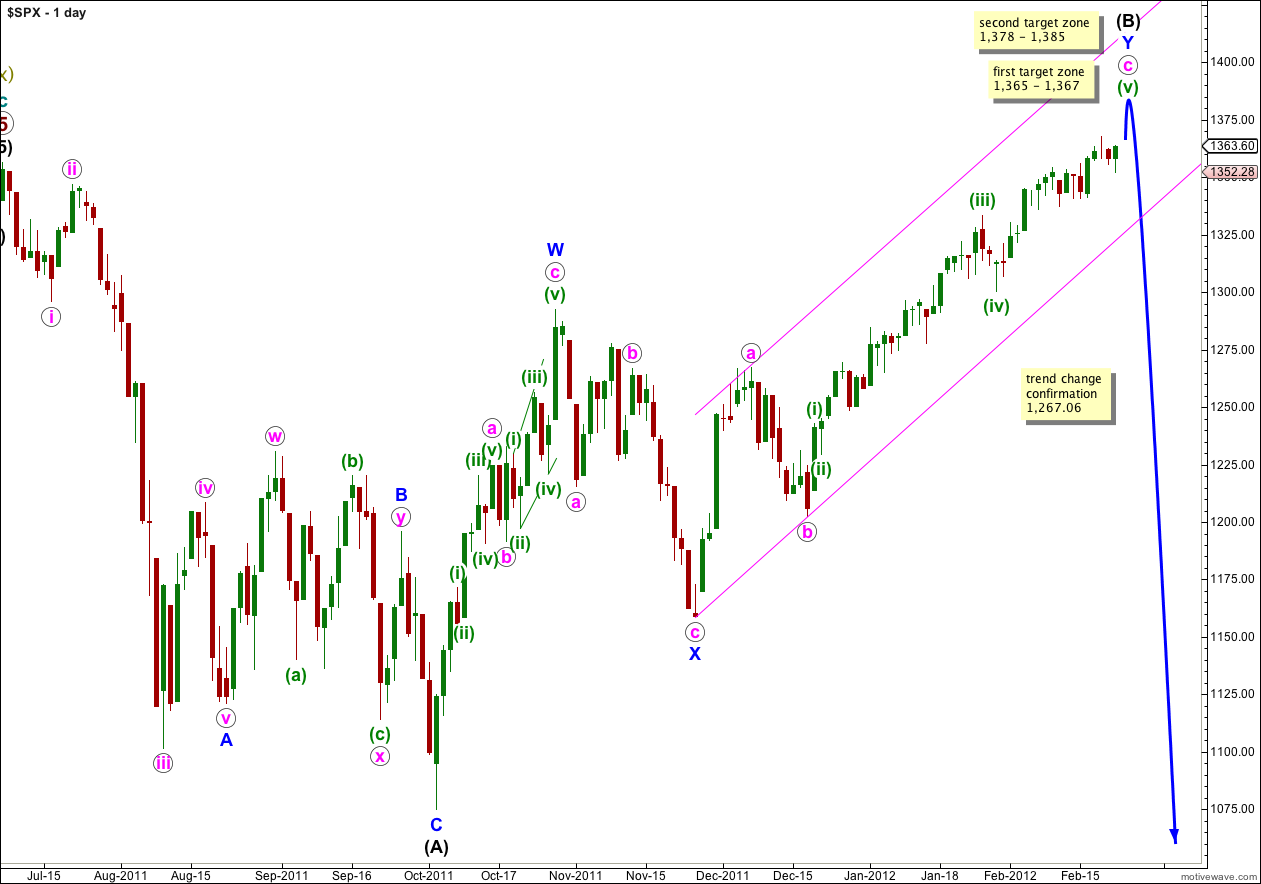
This main wave count follows on from our main historic monthly chart. It sees a flat correction at primary degree unfolding, and wave (B) black within that flat correction is close to completion (if it is not already complete).
Wave (B) black is here labeled as a double zigzag, which is a relatively common structure. When the second zigzag labeled wave Y blue is complete the probability that wave (B) black is complete will be very high indeed. The only wave wave (B) black could continue further would be as a rare triple zigzag and the rarity of this structure means it has a very low probability.
Wave (B) black may move beyond the start of wave (A) black, and in fact for flat corrections this is most common. The maximum common length of B in relation to A within a flat is 138%. This would be achieved at 1,459. It is likely we shall see a trend change before this price point.
We may use Elliott’s channeling technique to draw a channel about wave Y blue. When this channel is breached by a full daily candlestick below it then we shall have strong confirmation of a trend change.
Wave (C) black is extremely likely to take price below the end of wave (A) black at 1,074.77.
At this stage there is some divergence for the end of wave c pink within wave Y blue zigzag. This upwards trend certainly does have the look of an expiring trend.
Main Hourly Wave Count.
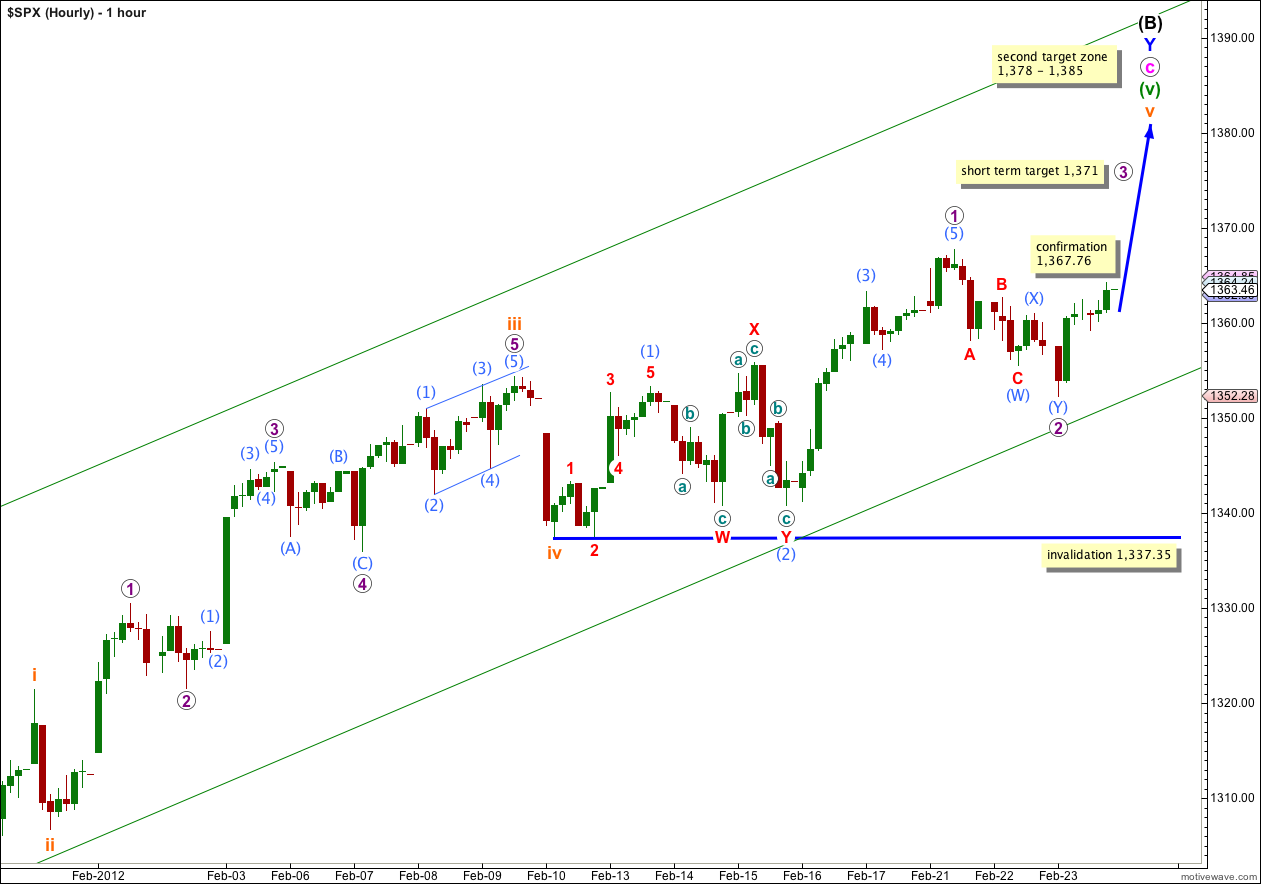
Wave 2 purple did extend lower as a double zigzag. Downwards movement found support before reaching the lower trend line and price has remained firmly within this parallel channel as we should expect it to do for this wave count.
At 1,371 wave 3 purple would reach 0.618 the length of wave 1 purple. About this short term target we may see the start of wave 4 purple, which may not move into wave 1 purple price territory.
This short term target does not leave a lot of room for wave 4 purple to move into and it may be too low. If this third wave moves strongly through this first target then the next expectation for it to end would be about 1,383 where it would reach equality with wave 1 purple. This second higher target requires a recalculation of the target for wave (B) black to end.
I will again leave the invalidation point down at the start of wave 1 purple and allow for further movement sideways, and a little lower, for wave 2 purple. At this stage wave 2 purple now looks like it is in better proportion to wave 1 purple that it is correcting, but were it to extend further it would still be proportional and have the right look. Again, any downwards movement would probably find support at the lower edge of the parallel channel.
I expect today that there is a higher probability that wave 2 purple is over and wave 3 purple is underway than there was yesterday.
Movement above 1,367.76 would provide stronger indication that wave 3 purple is underway. At that stage I would move the invalidation point up to the start of wave 3 purple at 1,352.28.
Alternate Hourly Wave Count.
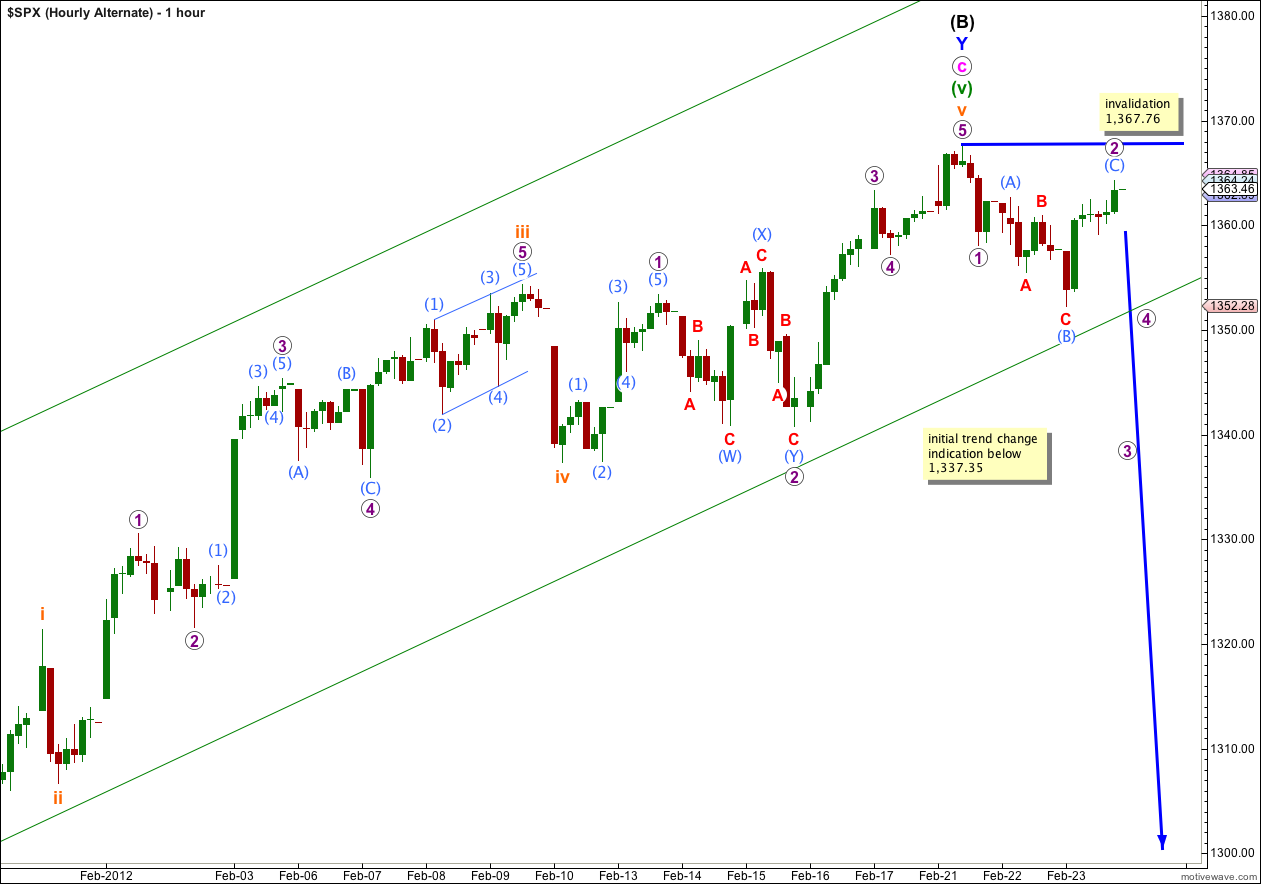
While price remains below 1,367.76 and above 1,337.35 both our hourly wave counts will remain valid. It is still possible that we have seen a large trend change from the S&P 500 a couple of days ago.
The only way to see recent movement for this wave count is a short first wave followed by an expanded flat correction for a deep second wave correction. This is slightly problematic in that it sees the short wave downwards labeled B red of (B) aqua within 2 purple as a five wave structure, and on the 5 minute chart this subdivides more easily into a three. This slightly reduces the probability that this wave count is correct.
Wave 2 purple may not move beyond the start of wave 1 purple. This wave count is invalidated with movement above 1,367.76.
Alternate Daily Wave Count.
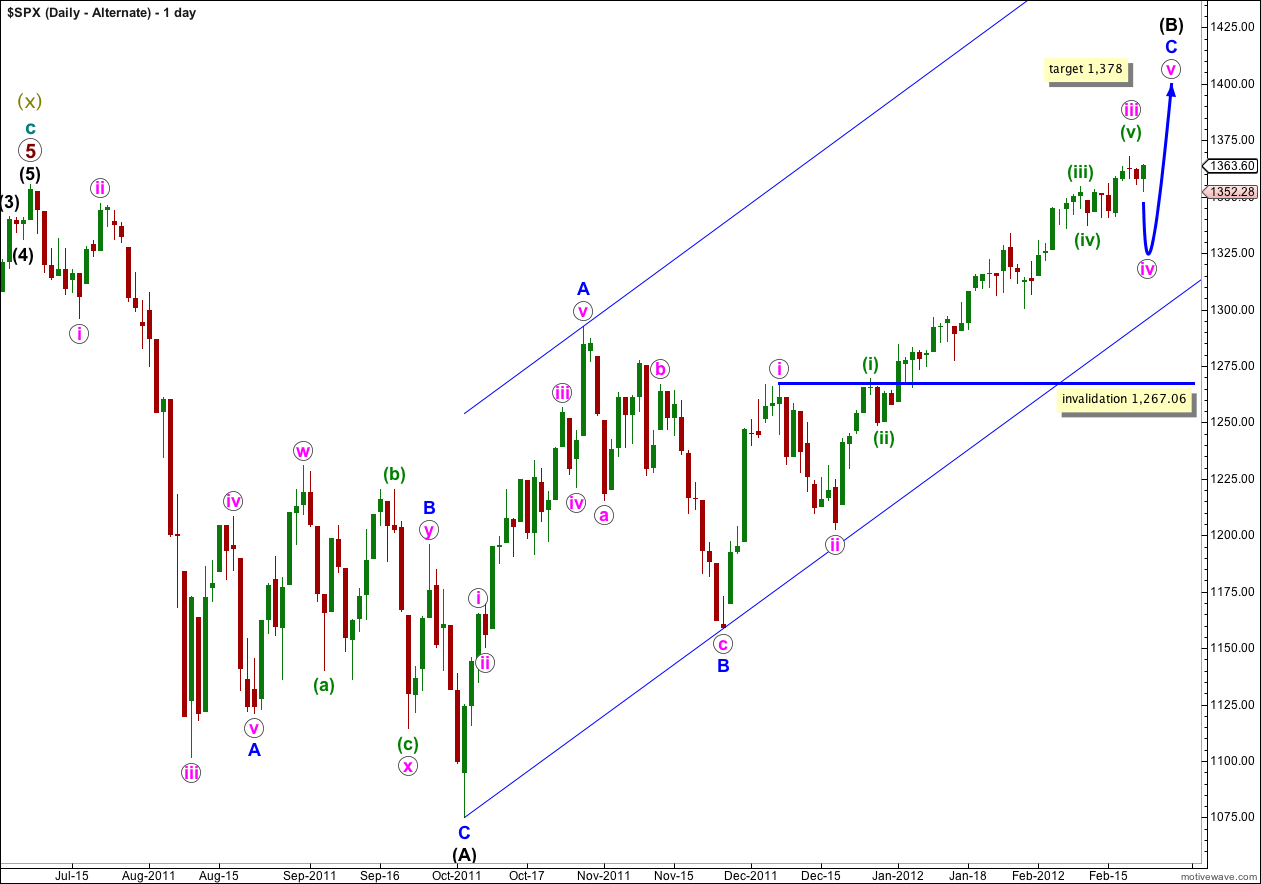
This alternate has a lower probability than the main daily chart.
If the upwards wave labeled here A blue was a five, and not a three, then wave (B) black is a single zigzag. Wave C blue is incomplete.
The subdivision of wave A blue as a five is not nearly as satisfactory as seeing it as a three, which the main wave count does. This is the reason why this alternate has a much lower probability.
It looks increasingly like wave iii pink would be incomplete. When wave iv pink begins we would expect it to last one to two weeks and be a relatively shallow correction of wave iii pink. It should look about equal in duration to wave ii pink.
Wave iv pink may not move into wave i pink price territory and this wave count is invalidated with movement below 1,267.06.