
We expected upwards movement to a new high, and price has made a very slight new high, but this movement looks to be a continuing correction.
The structure is still incomplete and we should see a continuation of this trend towards our targets.
Click on the charts below to enlarge.
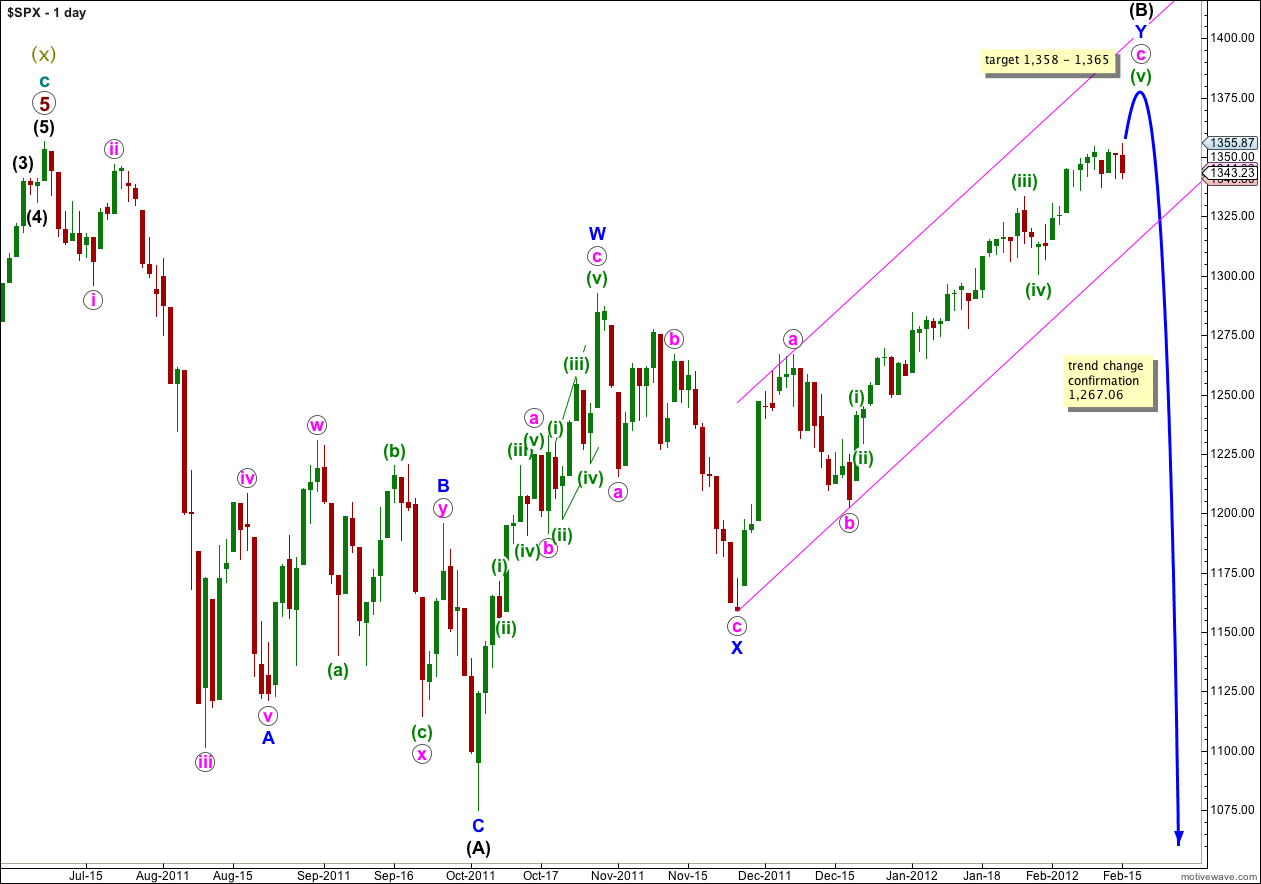
This main wave count has a higher probability than the alternate daily chart below because it sees wave W blue upwards as a three wave zigzag, which has a much better fit than trying to see it as a five wave impulse (the alternate idea).
Wave (B) black may move beyond the start of wave (A) black, and in fact for flat corrections this is most common. The maximum common length of B in relation to A within a flat is 138%. This would be achieved at 1,469. It is likely we shall see a trend change before this price point.
When wave (B) is complete then wave (C) must unfold in five waves down, as either an impulse or an ending diagonal. An impulse is the most likely and is easier to analyse. Wave (C) black does not have to make a new low below the end of wave (A) black, but it is extremely likely to do so.
There is unfortunately no clear Elliott wave rule regarding the length of wave (B) in relation to wave (A) for a flat correction. If price continues above 1,469 then this wave count would not be invalidated, but the probability would reduce significantly.
Movement below 1,267.06 would invalidate the alternate daily chart below and confirm this main wave count. At that stage we may have confidence that the S&P 500 has seen a trend change.
Movement below the parallel channel containing the zigzag for wave Y blue would also provide some indication of a trend change.
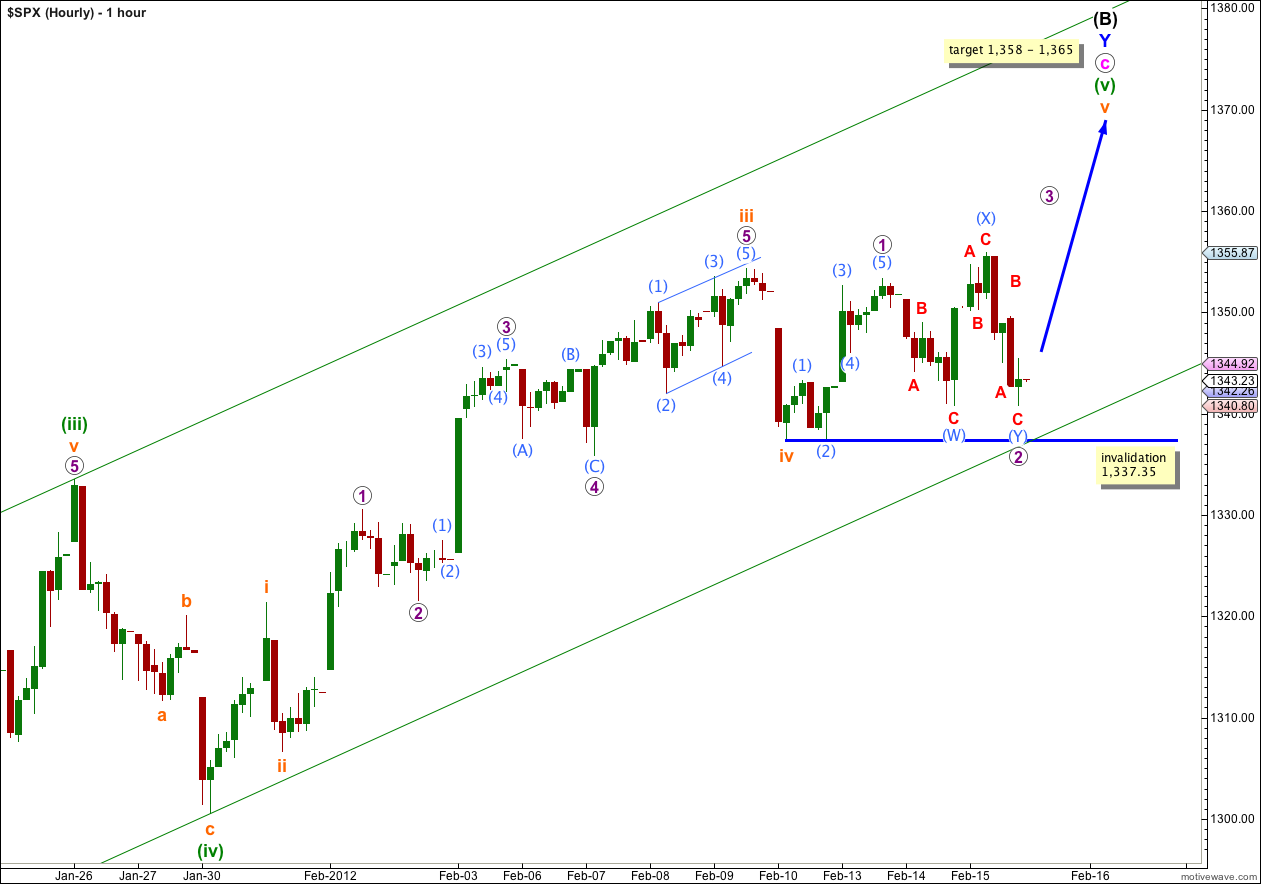
Upwards movement was expected and the S&P 500 did make a slight new high, but the upwards wave is a three and not a five.
I have checked subdivisions carefully on a 5 minute chart. The upwards wave labeled 1 purple is most easily seen as a five wave structure, the downwards wave labeled (W) aqua is a three, and the upwards wave labeled (X) aqua can only be seen as a three.
With a three down followed by a three up it looks like wave 2 aqua is incomplete and is continuing as a double zigzag correction. So far the downwards wave labeled (Y) aqua is unfolding as a zigzag which is either just complete or very close to completion at the end of Wednesday’s session.
Wave 2 purple may not move beyond the start of wave 1 purple. This wave count is invalidated with movement below 1,337.35.
Alternate Daily Wave Count.
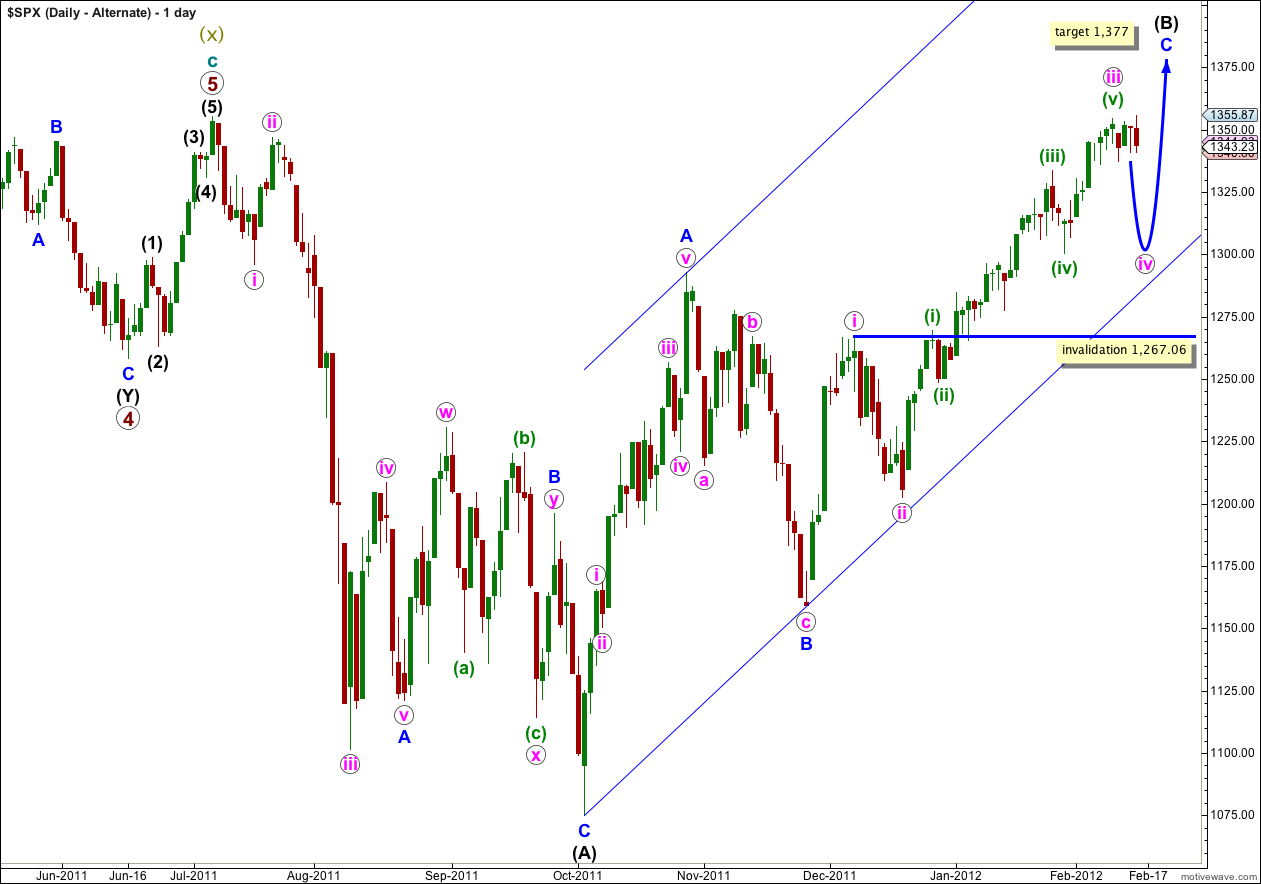
This alternate has a lower probability than the main daily chart.
If the upwards wave labeled here A blue was a five, and not a three, then wave (B) black is a single zigzag. Wave C blue is incomplete.
Wave iii pink is most likely now complete and wave iv pink has begun. Wave iv pink may last about one to two weeks. At this stage it looks like wave iv pink may move price mostly sideways as a flat correction, or a combination beginning with a flat.
Wave iv pink may not move into wave i pink price territory and this wave count is invalidated with movement below 1,267.06.
Nice call Lara,
With the VIX closing under the upper BB line today should give us a green light to go higher into your targets.
Thanks! I’ll be recalculating those targets today though, it just looks too low.
Thanks, will be looking for your updated targets.
I have three brothers working at banks they are talking about 1400 – 1440 April – May using a more bullish eye now. But they always do a lot of talking 🙂
Hi Lara,
Thank you for letting me try this out for 7 days.
Hi Lara, I use CMC Markets platform and charts which record price on a 24 hour basis. At 9pm NZ time today (16th NZ) the S&P has moved what look like 5 waves down to invalidate your hourly chart. It’s retracing now so you may not realise this at the NYSE open today. regards, Gary
okay, it looks like I will awake tomorrow to find my wave count invalidated. As much as I don’t like the look of waves ii and iv orange being out of proportion I think this is what would most likely be happening. On an hourly chart at these very low wave degrees waves don’t have to be in proportion, they often are but not always.
Lara – by the time i type this i hope it will be redundant…:)
No video today?
so sorry Craig, I’m often a “late” person. I had to go to a meeting today and did not manage to record the video until I got back home. It’s up now.
We got a new top today on the SPX, as you mentioned, but it was just slightly higher than the last top. So 0% chances we got Y blue or B Black, right? Lets wait how we open tomorrow morning. THank you for all your responses, we really appreciate it.
That’s correct, and especially because the slight new high was a three wave structure.
Wave (v) green does not look complete, yet.
Michael, but in the case we reached the top target (1360s) on futures this morning, that count to B black is completed and the main counting is still valid.
Lara may provide a better explanation to our concerns.
ES_F highest overnight was 1357. If we apply the same increase on the SPX (SPX 3 points higher than ES_F), we got 1360s. I know all your countings are applied to the SPX only, but is not a possibility we got that target on the early morning today? What do you think about it?
Also, current futures are invalidating main count. If they hold and we gap down, it would be good to understand the low target for the alternate count… Thanks.
Again, futures are I think more highly leveraged.
I’ve been analysing up to 5 markets a day for over 3 years now, and most of that for the first couple of years was Forex. Forex has extreme leverage and I came to be familiar with the different patterns and “feel” for each market.
I can tell you from my experience that highly leveraged markets charts look really different to stocks. This is one reason why I’ve settled to use EW analysis on the S&P 500; it’s easier, the EW structures are clearer and more obvious, and it has less common structures less often than forex.
On 11/25 you forecasted the bottom at 114.xx. Remember when I told you that we reached your number overnight via futures. The next morning the market reversed as you predicted. In my opinion, we should be considering the entire trading day, both day and night mainly because you have been so right about the targets. What are you thinking?
There are a couple of reasons why I’m using NY session only data.
The main reason is logistical. I’m using Motive Wave to label my charts, not because I want to use their auto label feature (I almost never use it, I always disagree) but because the labeling is dynamic. It saves me literally hours of time! The data feed I’m using with Motive Wave is Bar Charts and their S&P 500 data is NY session only, they don’t have an option for all hours data. I’m limited in my choice of data suppliers because I use a Mac.
Secondly, out of hours data has a much lower volume than NY session data. It would seem slightly odd to be using them side by side and pretending they’re the same, when they’re not. However, as out of hours trading increases with increasing globalisation and internet connectivity we may have to move to use this data. But that may be years away.
Finally I have another more personal selfish reason. If I’m using all hours data then if NY has a holiday I still have to provide analysis. I would get no statutory holidays at all. I rather like the odd day off, it’s good for mental health.
Sorry my responses are so late, I have been away today.
ES_F would be futures. Futures have a higher leverage available I believe, and so have more extreme price swings.
I’m only going to take the S&P 500 cash index into account, and I’m only going to take NY session data into account.