
As expected the S&P 500 continues to move higher. It seems likely that our new target will be reached.
We still have two daily charts and we can use the confirmation / invalidation point of difference between them to provide us with a high degree of confidence when we eventually see a trend change.
Click on the charts below to enlarge.
Main Wave Count.
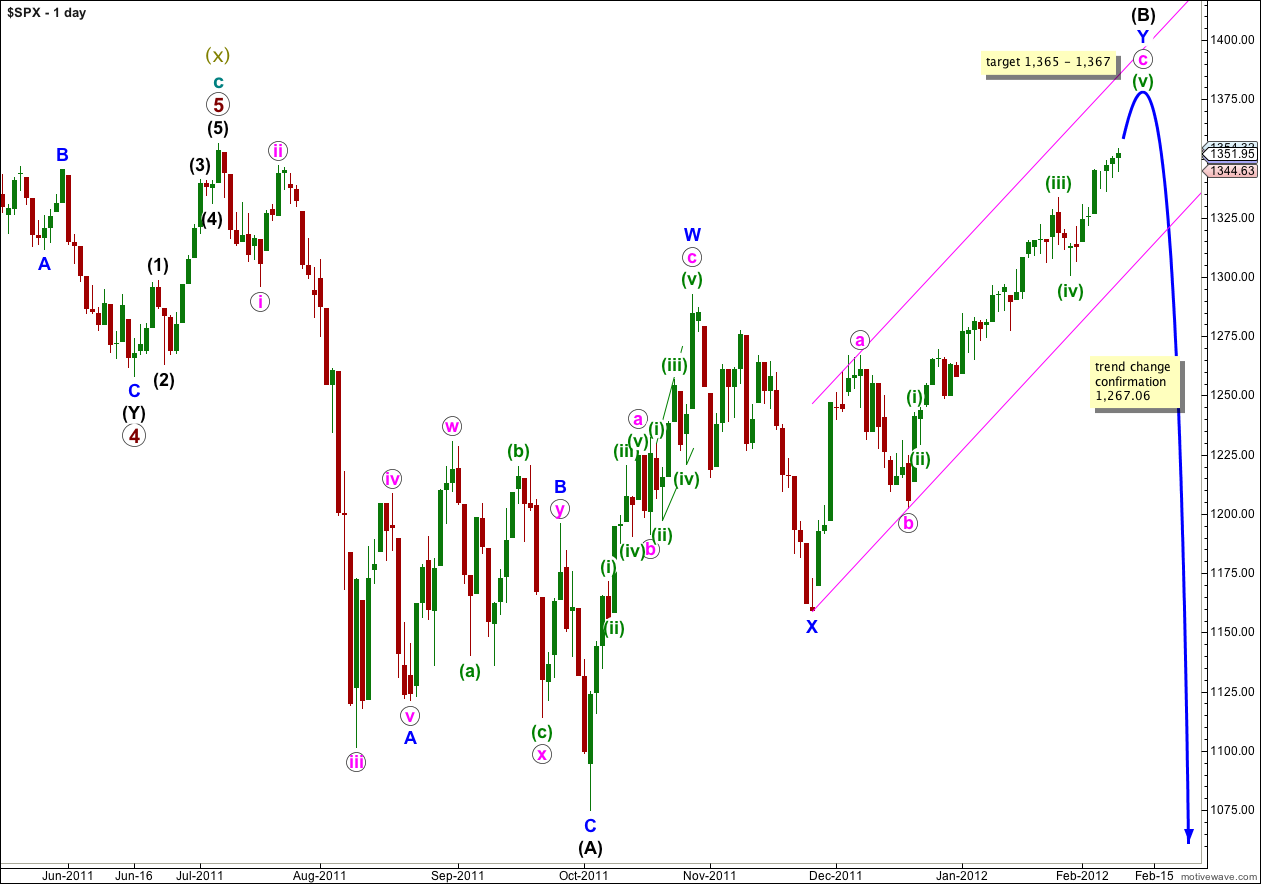
This main wave count has a higher probability than the alternate daily chart below because it sees wave W blue upwards as a three wave zigzag, which has a much better fit than trying to see it as a five wave impulse (the alternate idea).
Wave (B) black may move beyond the start of wave (A) black, and in fact for flat corrections this is most common. The maximum common length of B in relation to A within a flat is 138%. This would be achieved at 1,469. It is likely we shall see a trend change before this price point.
When wave (B) is complete then wave (C) must unfold in five waves down, as either an impulse or an ending diagonal. An impulse is the most likely and is easier to analyse. Wave (C) black does not have to make a new low below the end of wave (A) black, but it is extremely likely to do so.
There is unfortunately no clear Elliott wave rule regarding the length of wave (B) in relation to wave (A) for a flat correction. If price continues above 1,469 then this wave count would not be invalidated, but the probability would reduce significantly.
Movement below 1,267.06 would invalidate the alternate daily chart below and confirm this main wave count. At that stage we may have confidence that the S&P 500 has seen a trend change.
Movement below the parallel channel containing the zigzag for wave Y blue would also provide some indication of a trend change.
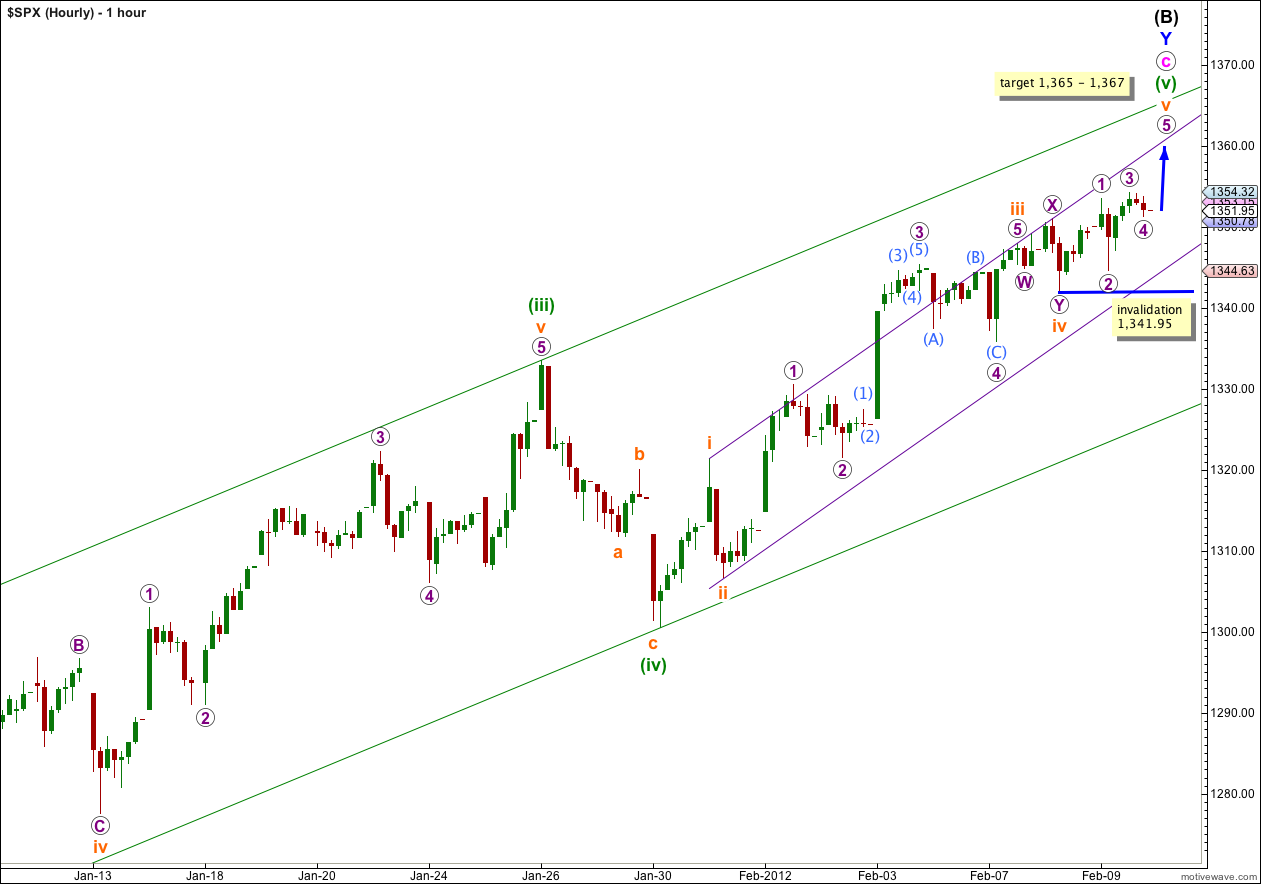
Upwards movement for the last two trading days is overlapping and choppy. On a 5 minute chart this movement subdivides nicely into zigzags more easily than impulses. This indicates an ending diagonal may be unfolding for wave v orange. Alternately, it could also be a leading diagonal in a wave 1 position within wave v orange.
If it is an ending diagonal then we may see the end of upwards movement soon, and it may fall a few points short of 1,365 ending about 1,361.
If it is a leading diagonal then price should remain above 1,341.95 for another week or two.
I have changed the labeling of wave iv orange slightly. Yesterday I had it labeled as an expanded flat correction and today it is labeled as a double zigzag. This is because a closer examination of wave Y purple downwards on the 5 minute chart sees this movement as a three, not a five. There is still excellent alternation between waves ii and iv orange.
We should expect price to end upwards movement at either the upper purple trend line (narrow channel) or the upper green trend line (wider channel).
At 1,367 wave v orange would reach 0.618 the length of wave iii orange. At 1,365 wave (v) green would reach 0.618 the length of wave (iii) green. This gives us a 2 point target for upwards movement to end.
Within wave v orange no second wave correction may move beyond the start of the first wave. This wave count is invalidated with movement below 1,341.95.
Alternate Daily Wave Count.
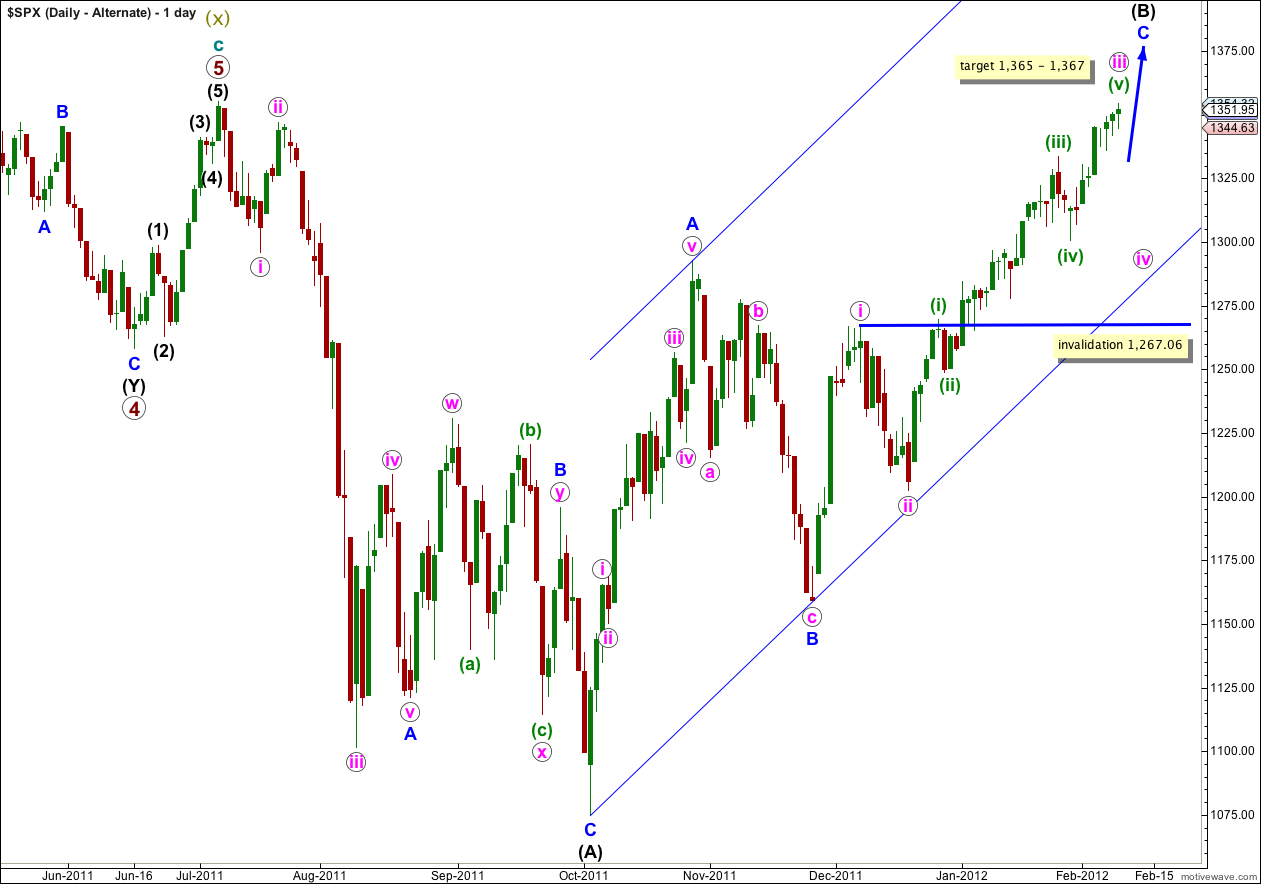
This alternate has a lower probability than the main daily chart, but we must consider it.
If the upwards wave labeled here A blue was a five, and not a three, then wave (B) black is a single zigzag. Wave C blue is incomplete.
When wave iii pink is complete then wave iv pink should unfold, lasting one to two weeks. Wave iv pink may not move into wave i pink price territory and this wave count is invalidated with movement below 1,267.06.