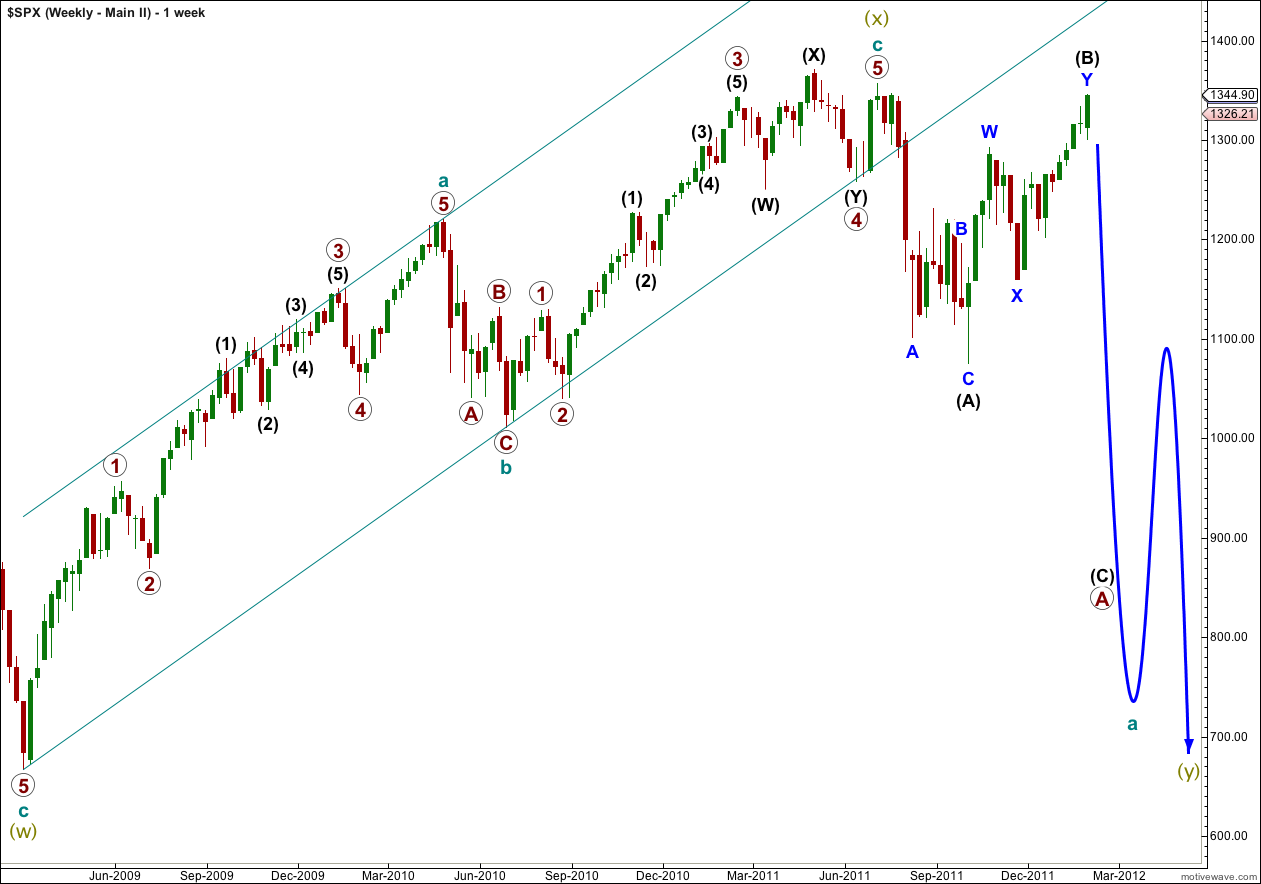
If our main wave count is invalidated by upwards movement then this is the alternate we shall use.
At the monthly chart level this wave count is the same as our main monthly wave count.
Click on the chart below to enlarge.
If super cycle wave (x) ended at 1,356.48 on 3rd July, 2011, then the following downwards movement is in a three wave structure. This is highly significant.
Super cycle wave (y) may be a flat, zigzag or triangle. It is most likely to be a flat or zigzag. If it is a flat then cycle a (teal green) must subdivide into a three, not a five.
If cycle a subdivides into a three then it may be either a flat or zigzag. If it is a flat then primary wave A within it must subdivide into a three.
Primary wave A as a three may be either a zigzag or a flat. If it is a flat then black wave (A) must subdivide into a three, which fits with this wave count.
When wave (A) black subdivides into a three that means wave (B) black may make a new price extreme beyond the start of (A) which is at 1,356.48. In fact, the most common type of flat is an expanded flat which would require wave (B) black to end at or above 1,370.57.
If price moves above 1,359.44 then this will be the wave count I will use. The subdivisions fit much better than my previous attempt to find an alternate last week, and it has a higher probability. It still sees the upwards wave labeled super cycle (x) as a three wave structure which is what it looks like most easily on weekly and monthly charts, and it is nicely contained within its trend channel drawn using Elliott’s technique.
This alternate has the same mid to long term bearish outlook as our main wave count. It is just the structure of super cycle wave (y) which differs between the two. This alternate, and our main wave counts, are not as bearish as Prechter’s wave count which I have as an alternate in the historic analysis.
However, the probability of this alternate is still lower than the main weekly and monthly charts. This is because cycle wave a as a three wave structure would be more likely to be a zigzag than a flat, and we would be expecting a five down for primary wave A, and not a three.


yes, it seems we are going down according to EW and other technical indicators, but we have been in similar situation for weeks. Thanks for your response.
Month Charts Last Change Prior
Settle Open High Low Volume Updated
Mar 2012
1321.50 -17.50 1339.00 1321.75 1322.50 1321.25 20,280 12:32:00 PM CT
2/4/2012
So, down 17.5 here are the last 5 trades. We will see what happens in a few hours. Note the price…
Globex Futures|Globex Options
Expiration
Time Period
About this Report
Time and Sales for MAR 12 E-mini S&P 500 (Dollar) Futures (GLOBEX)Trade Date: 02/03/2012
Calendar Date Time Price Size Indicator
2/3/2012 15:59:53 132300.0 1 –
2/3/2012 15:59:46 132300.0 1 –
2/3/2012 15:59:17 132300.0 1 –
2/3/2012 15:59:01 132275.0 1 –
2/3/2012 15:59:00 132300.0 1 –
sou you are not expecting or see lower probability we are going higher than the 2011 high?
Take a look at the e-mini futures contract. It appears that your comment is mute….
That is correct.