
The S&P 500 continues to move lower as our wave count expects. We have some initial confirmation today of a trend change on the hourly chart and I can now calculate targets. We will have final confirmation of this trend change when the channel on the daily chart is breached. At that stage we may have much greater confidence in this main wave count.
Click on the charts below to enlarge.
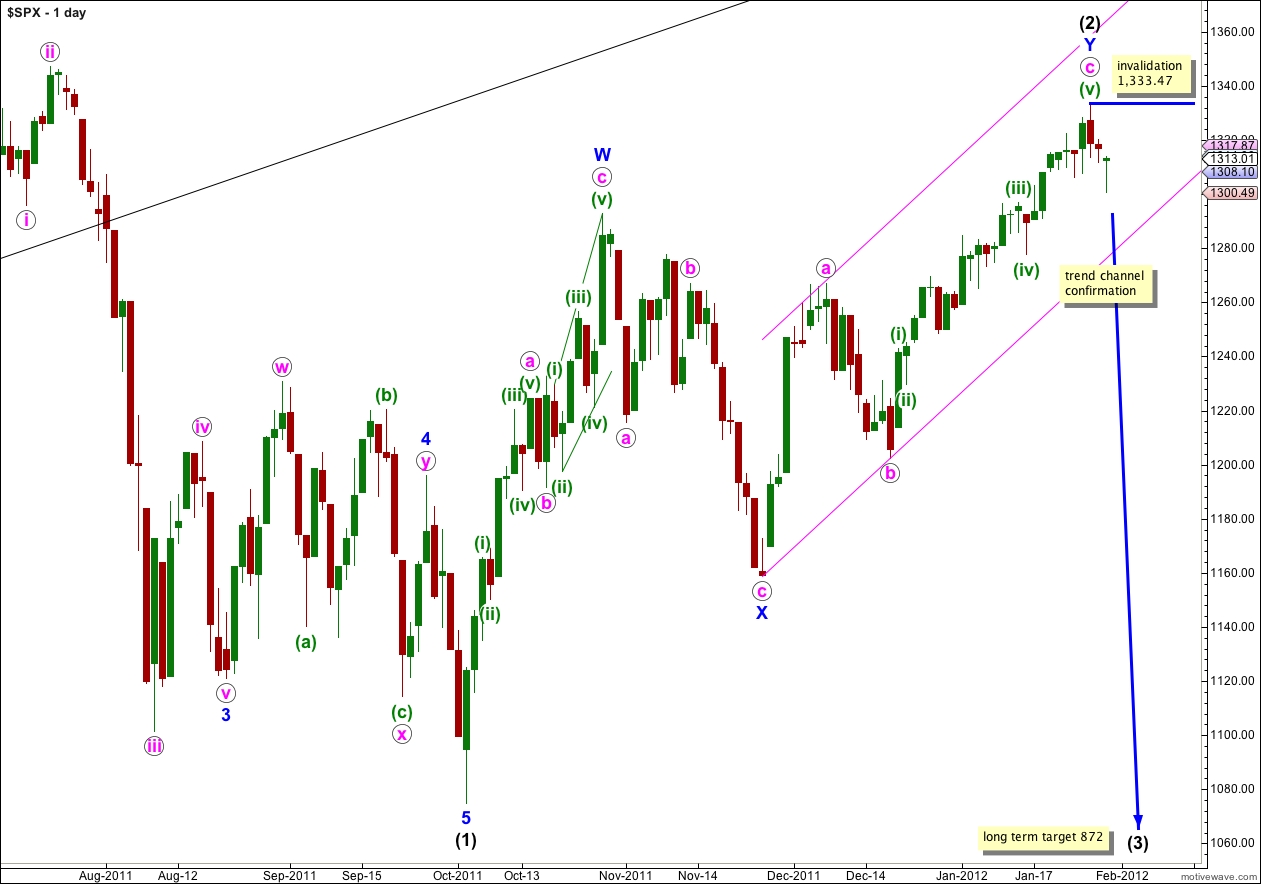
With some initial confirmation of a trend change I will now move the invalidation point down to (2) black at 1,333.47. Within wave (3) black no second wave correction may move beyond the start of the first wave.
Wave (3) black would reach 1.618 the length of wave (1) black at 872. This long term target is months away; wave (1) black lasted 4 months and wave (2) black lasted 3 months. We may expect wave (3) black to last at least 2 months and possibly longer.
The main historic wave count sees primary wave A as a five wave structure, and this is wave (3) black within it. However, primary wave A may also be a three wave structure and we would relabel this downwards movement black wave (C). Third waves and C waves share many similar characteristics, and they both must subdivide into fives, and at this early stage the difference is slight.
When the parallel channel containing wave Y blue zigzag is breached by downwards movement then we shall have final confirmation of this big trend change. We may get this confirmation this week or next.
Wave (2) black is labeled here as a double zigzag structure, which is relatively common. The only way wave (2) black could continue further sideways when the second zigzag of Y blue is over is as a rare triple zigzag. The rarity of triples means this has a very low probability. Furthermore, the purpose of triple zigzags is to deepen corrections. Wave (2) black is already a very deep correction of wave (1) black and it does not need to be deepened further.
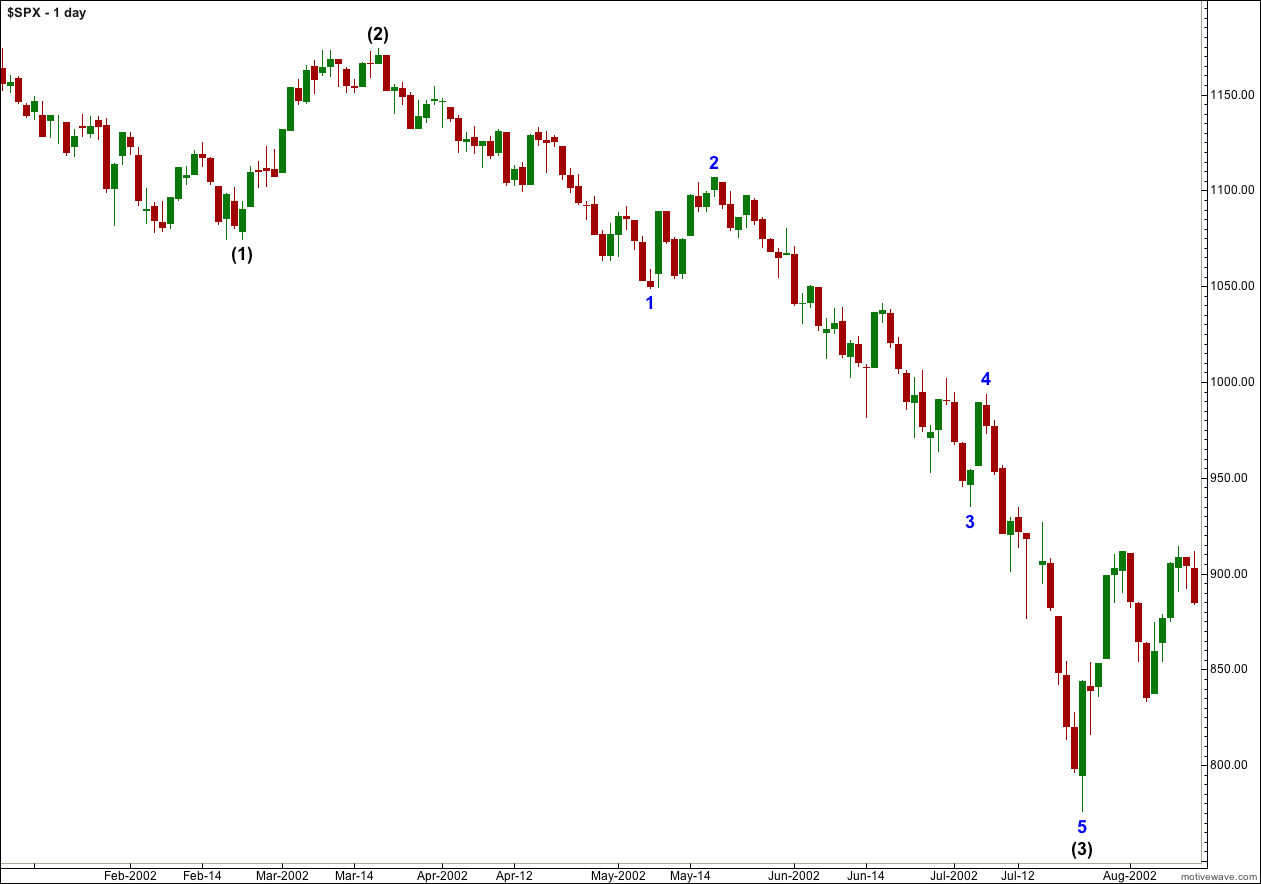
There are two comparable pieces of movement for this current third wave: from September 2000 to October 2002 and from October 2007 to March 2009. Looking back at the third waves within those downwards movements we can see that they do not necessarily need to start with extremely strong downwards movement. The chart above shows movement from 19th March 2002 to 7th May 2002. This was a first wave within an equivalent third wave (of a primary C wave). This movement had days where price moved less than 10 points. We should expect similar behaviour at this stage.
When we move into the middle of this third wave, that is when downwards movement should be very strong.
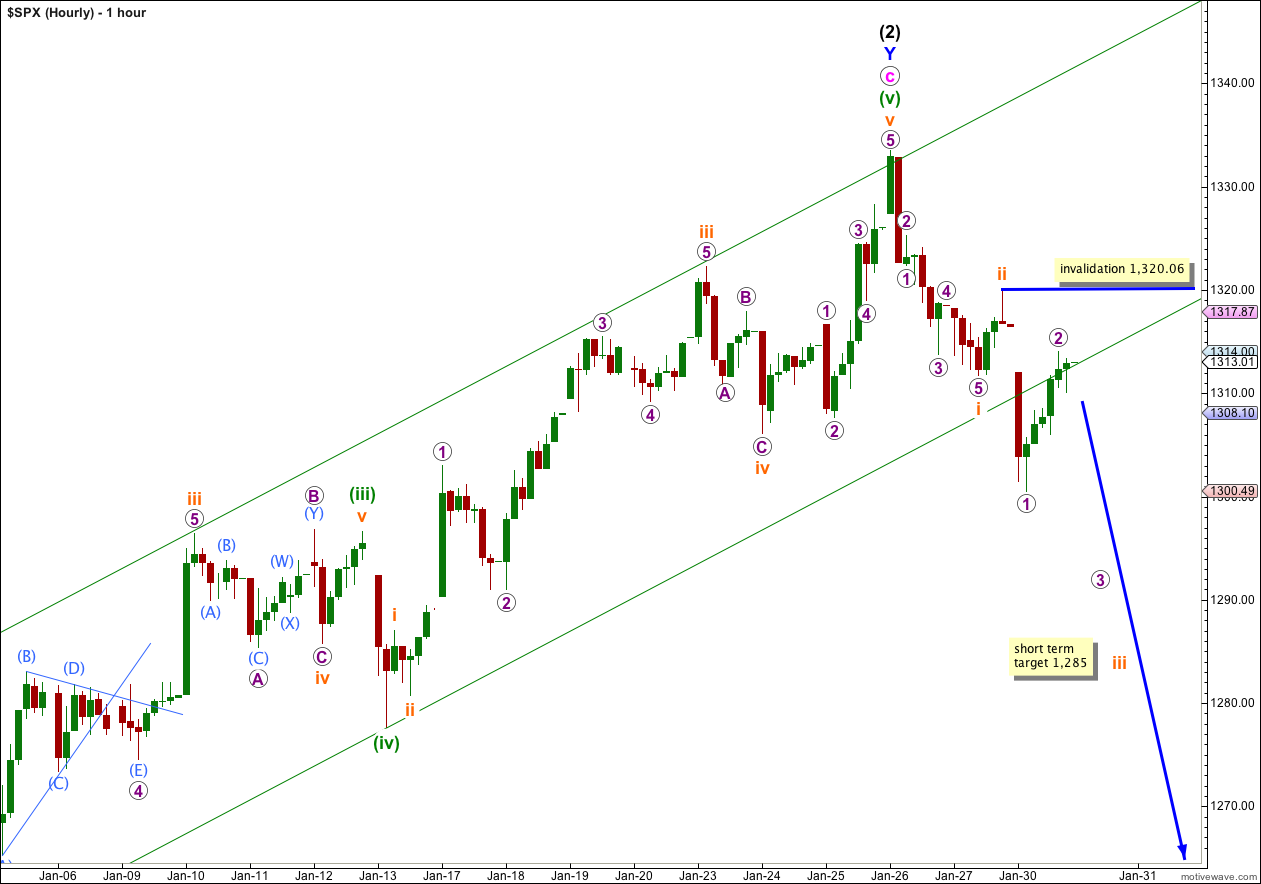
Within the first 5 minutes of Monday’s session price moved outside of the parallel channel as drawn here on the hourly chart, for the first time since 20th December 2011. Thereafter, another small second wave correction has found resistance about the lower edge of this channel.
At 1,285 wave iii orange would reach 1.618 the length of wave i orange. This target may be reached this week.
We should see an increase in momentum for wave 3 purple of iii orange tomorrow.
When wave 3 purple is complete we may use Elliott’s channeling technique to draw a parallel channel around this downwards movement. Draw the first trend line from the lows of 1 to 3 purple and place a parallel copy on the high of 2 purple. Waves 4 and 5 purple may end about the upper and lower edges of this channel respectively.
Wave 2 purple within wave iii orange may not move beyond the start of wave 1 purple. This wave count is invalidated with movement above 1,320.06.
Lara,
It looks more like 3 waves down off the recent 1333 high. Could what you have labeled as the end of Primary 2 up have only been the end of the third of a fifth wave up, with the final fifth wave underway now?
Or perhaps we are in the early stages of a leading diagonal for the beginning of P3?
Peter