
Tuesday’s session began as we had expected with a little downwards movement, which was over within 5 minutes, and ended 0.94 points below our short term target. Thereafter, price has turned back upwards as expected.
With more structure to analyse, the upwards target has been calculated now with two wave degrees. We should expect price to continue this trend towards our target, most likely, before turning downwards.
We still have two hourly wave counts. If one more is invalidated within the next day or two we shall have more confidence in our expectation of the next direction.
Click on the charts below to enlarge.
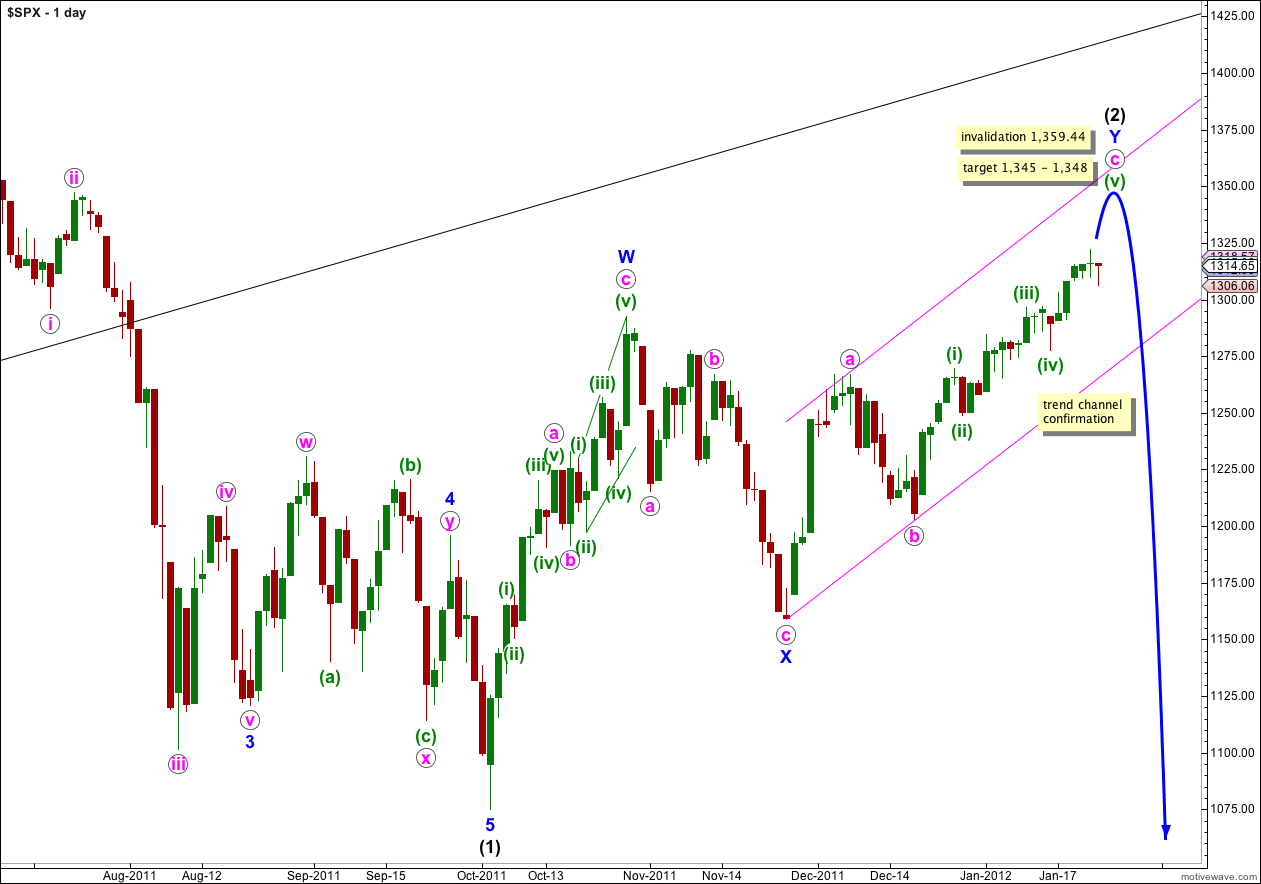
Again, upwards movement remains within a narrow band of the midline of this parallel channel. We should expect it to continue to do so. When downwards movement varies significantly from this narrow band we shall have an early indication of a trend change.
Waves a and b pink both lasted a Fibonacci 8 days. If wave c pink is continuing and if it is to have a Fibonacci time relationship then the next possible end date is 8th February, where it would have lasted a Fibonacci 34 days. However, Fibonacci time relationships are not very reliable. This possible end date is a rough guide only, it does not have a high probability.
When the pink parallel channel containing wave Y blue zigzag is breached by downwards movement then we shall have confirmation of a trend change.
Wave (2) black is labeled here as a double zigzag structure, which is relatively common. The only way wave (2) black could continue further sideways when the second zigzag of Y blue is over is as a rare triple zigzag. The rarity of triples means this has a very low probability. Furthermore, the purpose of triple zigzags is to deepen corrections. Wave (2) black is already a very deep correction, over 80% of wave (1) black. It does not need to be deepened further.
Wave (2) black may not move beyond the start of wave (1) black. This wave count is invalidated with movement above 1,359.44.
When second wave corrections become very deep I am always asked about the possibility of the invalidation point being breached. The only alternate I can see which would allow movement above 1,359.44 (or the price high at 1,370.58 if I have the end of primary 2 wrong) would have to see the long rise from March 2009 to May 2011 as a five wave structure. When I look at this rise, the “recovery”, on weekly and monthly charts it has a very strong three wave look to it. I have a big problem with any wave count which tries to count that rise as a five wave movement, and that seems to be stretching Elliott wave rules so much as to make them useless.
It is possible to count that rise as a five. I have seen wave counts which do this, and I admit that I could be wrong. I advise members to look at that movement on weekly and monthly charts for yourselves and make your own judgement as to how it looks, and how strong my wave count is.
Main Hourly Wave Count.
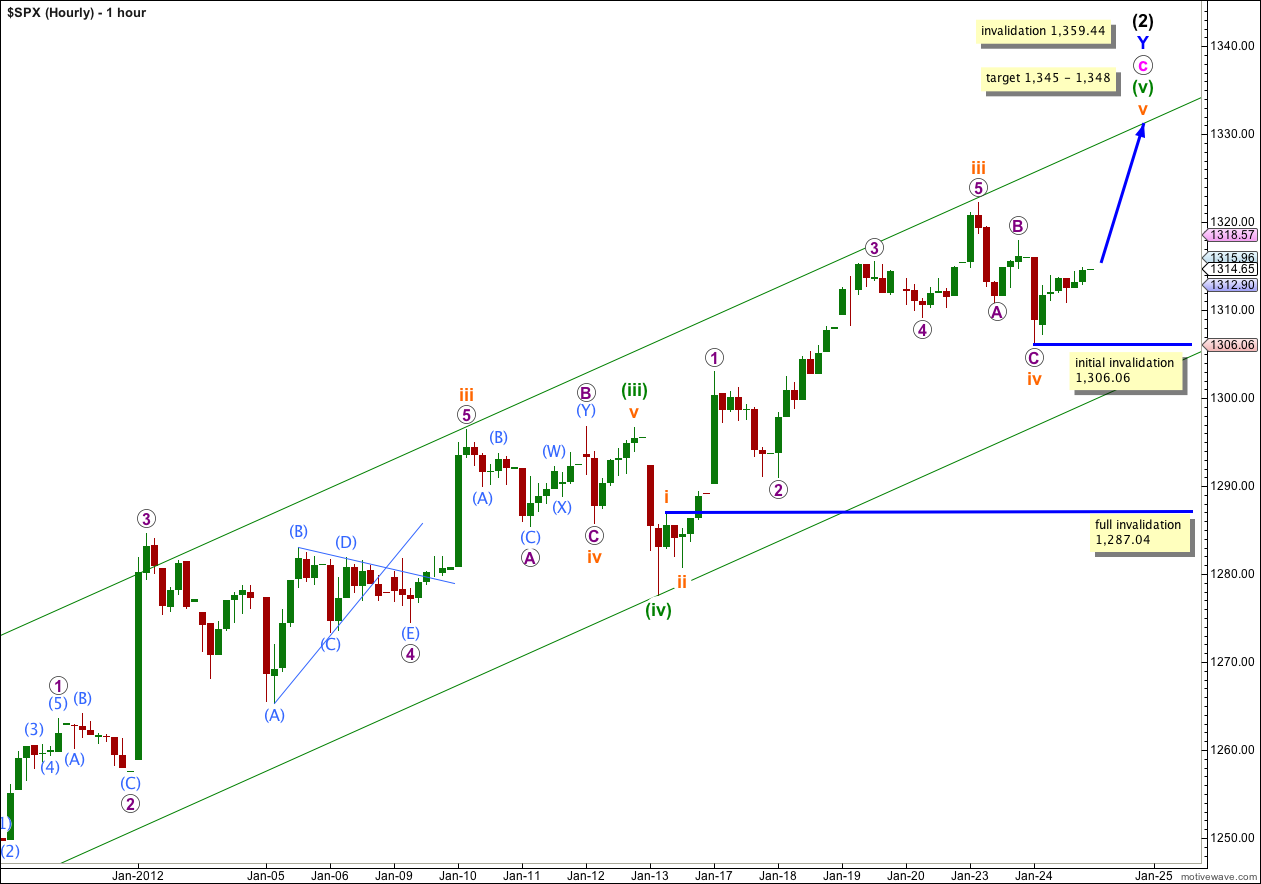
Wave C purple brought price very close to our expected target. Within wave iv orange waves A and C purple are just 0.94 off equality.
If wave iv orange is over here, and it is highly likely that it is, then we should not see movement below 1,306.06 while wave v orange upwards completes.
At 1,348 wave v orange would reach equality with wave iii orange. However, there is already a good Fibonacci ratio between orange waves within wave (v) green. Wave iii orange is 1.56 points longer than 4.236 the length of wave i orange. We may not see a Fibonacci ratio between wave v orange and either of i or iii.
At 1,345 wave (v) green would reach equality with wave (iii) green. However, there is already a good Fibonacci ratio between green waves within wave c pink. Wave (iii) green is 1.7 points longer than 1.618 the length of wave (i) green. We may not see a Fibonacci ratio between wave (v) green and either of (i) or (iii) green.
The best place to see where upwards movement may end is probably the upper edge of this parallel channel. Draw the first trend line from the lows of (ii) green (off to the left of the chart, you can see it on the daily chart) to (iv) green, then place a parallel copy upon the high of wave iii orange within (iii) green. This channel is a “best fit” and has worked well for us. Wave v orange may end about the upper trend line.
It is most likely that wave iv orange is over, but it is possible that it could continue further sideways and a little lower. If 1,306.06 is breached by downwards movement then that would be my first expectation. Wave iv orange could continue lower as a double zigzag, sideways as a triangle, or a double combination.
If 1,306.06 is breached then the invalidation point moves down to 1,287.04. Wave iv orange may not move into wave i orange price territory.
If price moves below 1,287.04 then we shall use the alternate wave count below and expect that it is very likely we have seen a major trend change.
Alternate Hourly Wave Count.
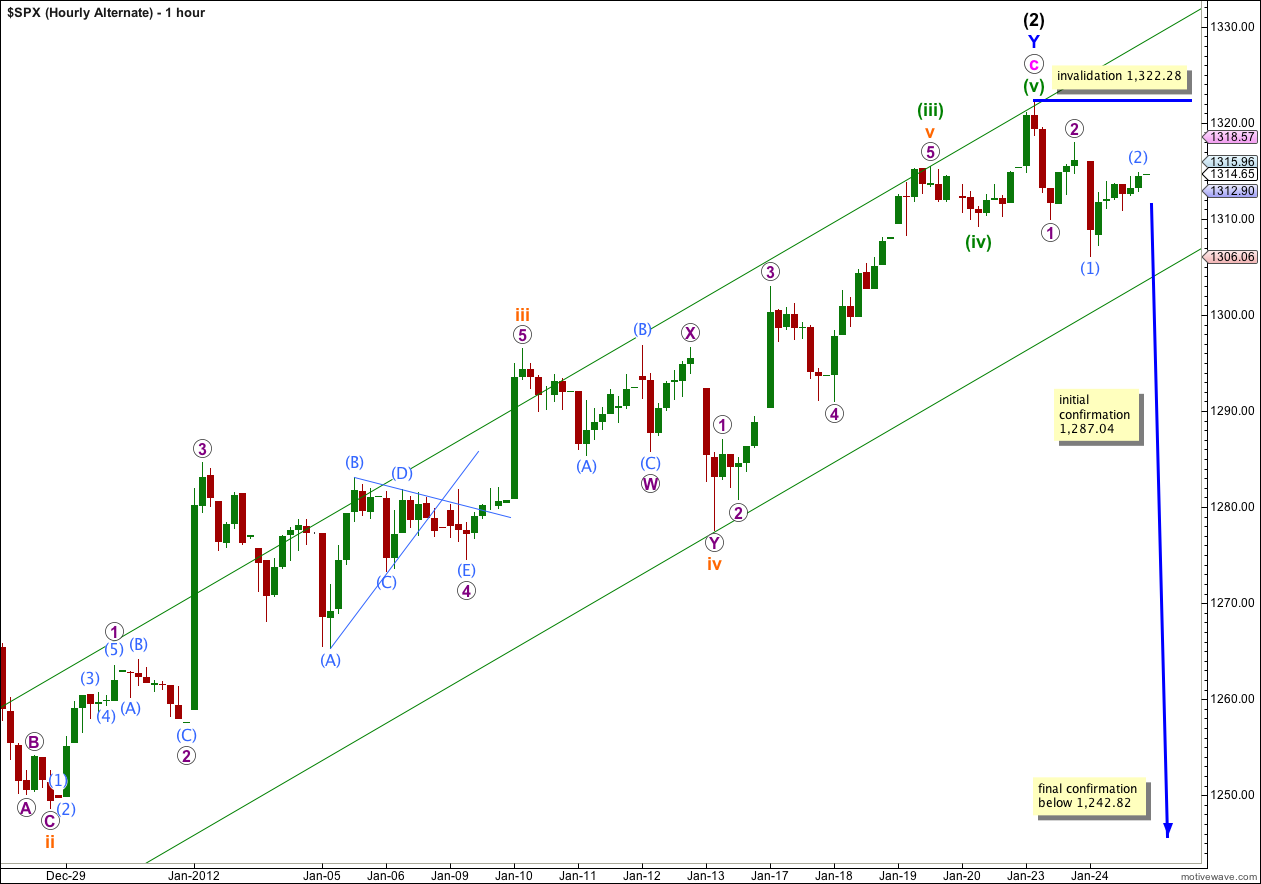
It is possible to see a completed five wave impulsive structure for wave c pink. If wave c pink was over at 1,322.28 then it lasted 22 days, just one more day than a Fibonacci 21. This would be close enough to consider that wave c pink had a Fibonacci duration (one day either side of the Fibonacci number).
Wave c pink would have been 11.51 points longer than equality in length with wave a pink, close enough to say they had a relationship of equality as this is less than a 10% variation.
Ratios within wave c pink are: wave (iii) green has no Fibonacci ratio to wave (i) green, and wave (v) green is just 0.56 points longer than 0.146 the length of wave (iii) green.
If this wave count is correct then recent downwards movement may be seen as a series of small first and second waves; this has the same internal structure as A-B-C.
This alternate wave count would be strongly invalidated with any movement above 1,322.28. No second wave correction may move beyond the start of the first wave. With movement above 1,317.97 the probability of this alternate being correct will be greatly reduced.
Movement below 1,287.04 would provide initial confirmation that this wave count is correct because at that stage the main wave count would be invalidated.
Movement below 1,242.82, the high of (i) green within c pink, would provide strong confirmation of this wave count. At that stage any alternate which saw downwards movement as a fourth wave correction within wave c pink would be invalidated. At that stage I would not be able to see any alternate which would allow for wave c pink to continue upwards.
Lara,
You say the only alternate that would allow for movement above 1359 would be if the rise from the March 2009 low is seen as a five.
Is it possible that Primary 2 is unfolding as a double zig zag, with the rise into the May 2011 high as only Wave W, and the fall into the October low as a 3-wave X wave?
This doesn’t seem likely, given how mature the recent advance seems. But I was just wondering if it works.
Peter
Peter,
That scenario does not fit – so far.
From the end of the upwards three (primary 2) at 10th May, 2010, to the low of black (1) at 4th October, 2011 is a clear five. For primary 2 to be continuing as a double zigzag that downwards movement would have to be seen as a three wave movement for an X wave.
Also, the purpose of a double zigzag is to deepen a correction and primary 2 is already 77% of primary 1. It does not need to deepen.
The purpose of a double combination is to move price sideways and take up time. Primary wave 2 is already 26 months in duration compared to 16 months duration for primary wave 1. Primary 2 does not have to take any longer.
So, your idea only works if we see black (1) as a three, not a five, and if primary 2 ends up being even more time consuming and possibly deeper than it already is.
Lara, how should we label 2000(high), 2002(deep) and 2007(high) levels on a historical S&P index chart?
like this:
http://elliottwavestockmarket.com/category/spx500-historical-analysis/
I am new to elliott analysis, could you please explain how do you label 2000(high) as “0”?Thanks
That’s an excellent question.
I have not labeled the previous high as the end of a wave. It would be the end of either a third or fifth wave at supercycle degree.
The start of the correction is labeled as “0” as a beginning. The “0” is basically only there to indicate this is where the large correction begins without labeling the end of the previous upwards movement.