
Elliott Wave chart analysis for the S&P 500 for 20th May, 2011. Please click on the charts below to enlarge.
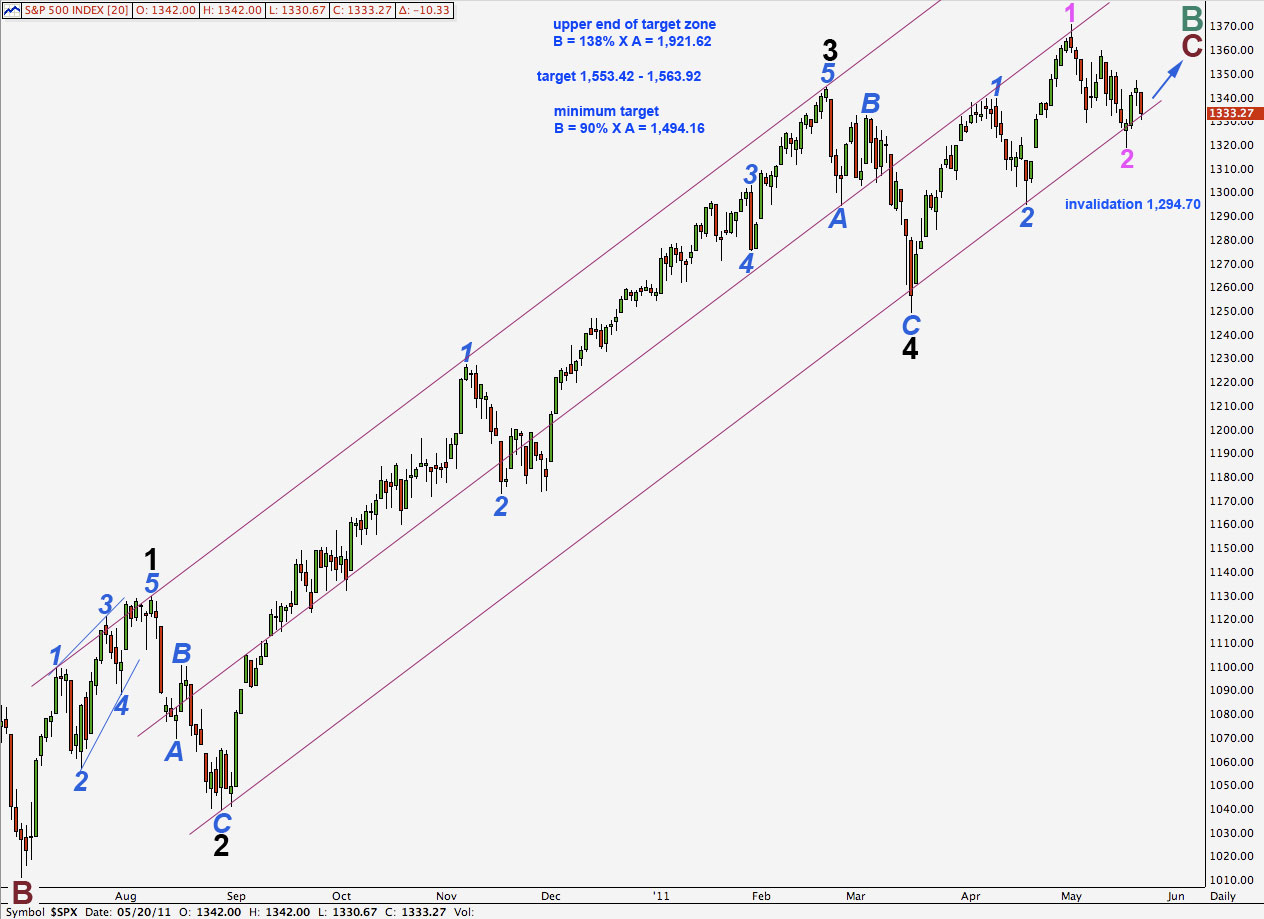
Because some indices have made new all time highs I am switching over our main and alternate historical counts. This count below will now be our main preferred wave count and it allows for new all time highs in the S&P 500.
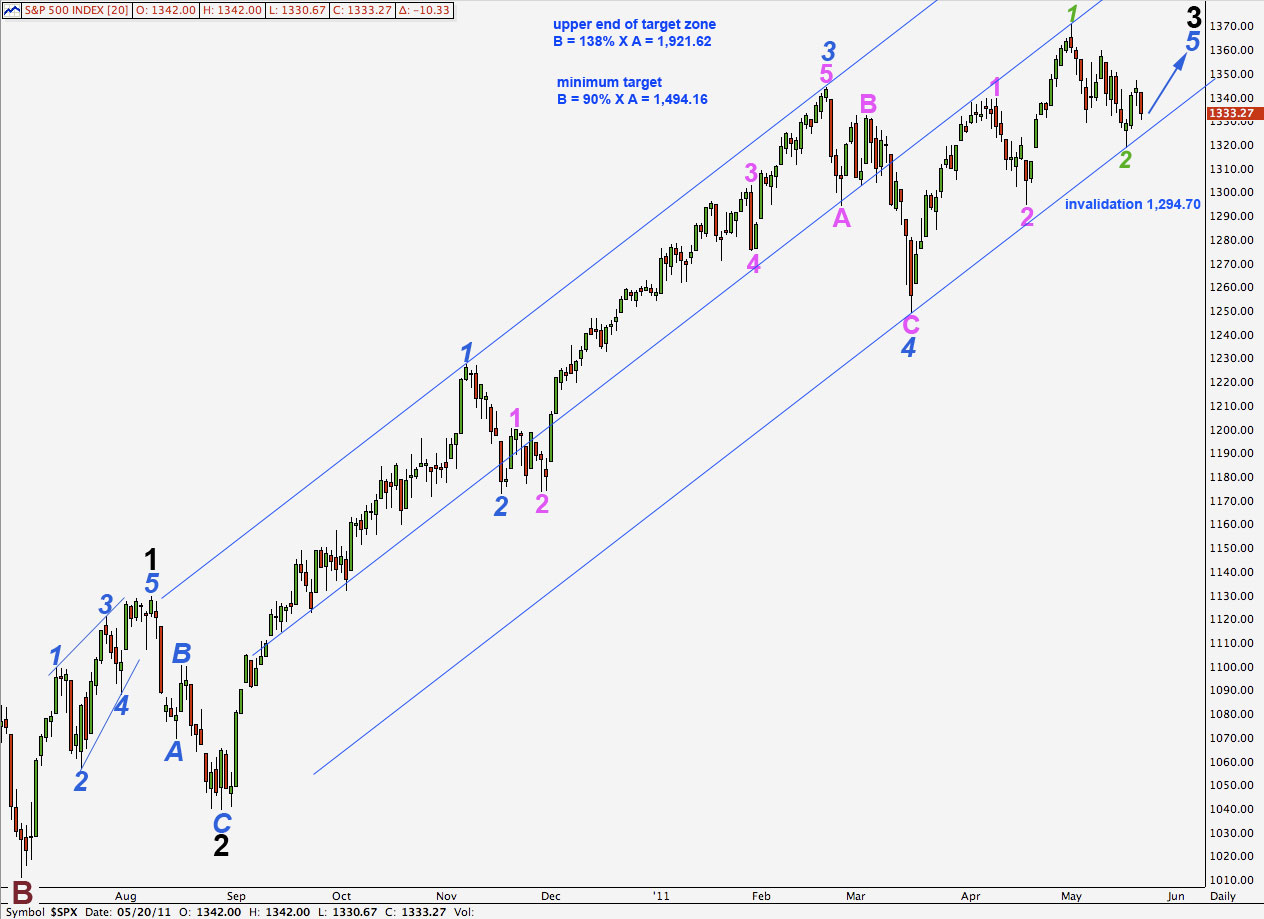
Monthly Chart.

We have had this wave count as an alternate for quite some time now.
This wave count sees the all time high at 1,576.09 as the end of cycle wave 5 to end a super cycle impulsive structure.
The fall down to 666.8 is labeled as a three wave structure; as a three, A-B-C, it has a better fit than labeling it as a five. Within cycle wave A downwards primary wave C is 62 points short of 2.618 the length of primary wave A, an 8% variation, which is acceptable.
Within cycle wave A down primary waves A and C both subdivide nicely into impulses.
When an A wave subdivides into a three wave structure the correction is either a flat or a triangle (or a combination with a flat as the first structure). After the extremely long sustained rise to the all time high at 1,576.09 it would probably not be followed by a triangle, as that may not retrace to a reasonable depth. A flat is more likely and we will keep a possible triangle structure in mind, as it is technically possible.
If cycle wave A down was the first three of a flat correction then the most common type of flat is an expanded flat, which requires B to move beyond the start of wave A, which would see a new all time high for the S&P 500.
A flat correction requires wave B to be at minimum 90% the length of wave A. This gives us a minimum expectation of upwards movement to reach 1,494.16.
The most common maximum length of wave B in relation to wave A of a flat correction is 138% which is achieved at 1,921.62. We would expect a big trend change to occur before this point.
Although cycle wave A was relatively brief for a cycle degree A wave, the minimum expectation for cycle wave duration is about a year and this one was about a year and a half, which is acceptable.
The duration of cycle wave B is what we would expect so far from a cycle degree wave, about 2 years and still incomplete.
This wave count fits better in terms of duration.
Main Daily Wave Count.
This daily chart shows all of primary wave C to end cycle wave B zigzag. The wave degrees have all been moved up one from our last wave count.
Despite the slightly odd look of wave 3 black this wave count has a higher probability than the alternate below.
Wave 3 black is just 5.42 points short of 2.618 the length of wave 1 black.
Ratios within wave 3 black are: wave 3 blue has no fibonacci ratio to wave 1 blue and wave 5 blue is just 2.61 short of 0.382 the length of wave 1 blue.
Wave 3 black is longer than wave 1 black and so wave 5 black is not limited.
Wave 3 blue within wave 5 black is developing as an extension.
The trend channel is drawn using Elliott’s technique and contains this upwards movement very well. The first trend line is drawn from the highs of 1 to 3 black and a parallel copy is placed upon the low of 2 black. Wave 4 black has an overshoot of the channel, wave 2 blue within wave 5 black ends perfectly on the lower trend line, and wave 2 pink has a small overshoot.
Until wave 5 black has a complete five wave structure we may expect this channel to contain upwards movement.
Main Hourly Wave Count.
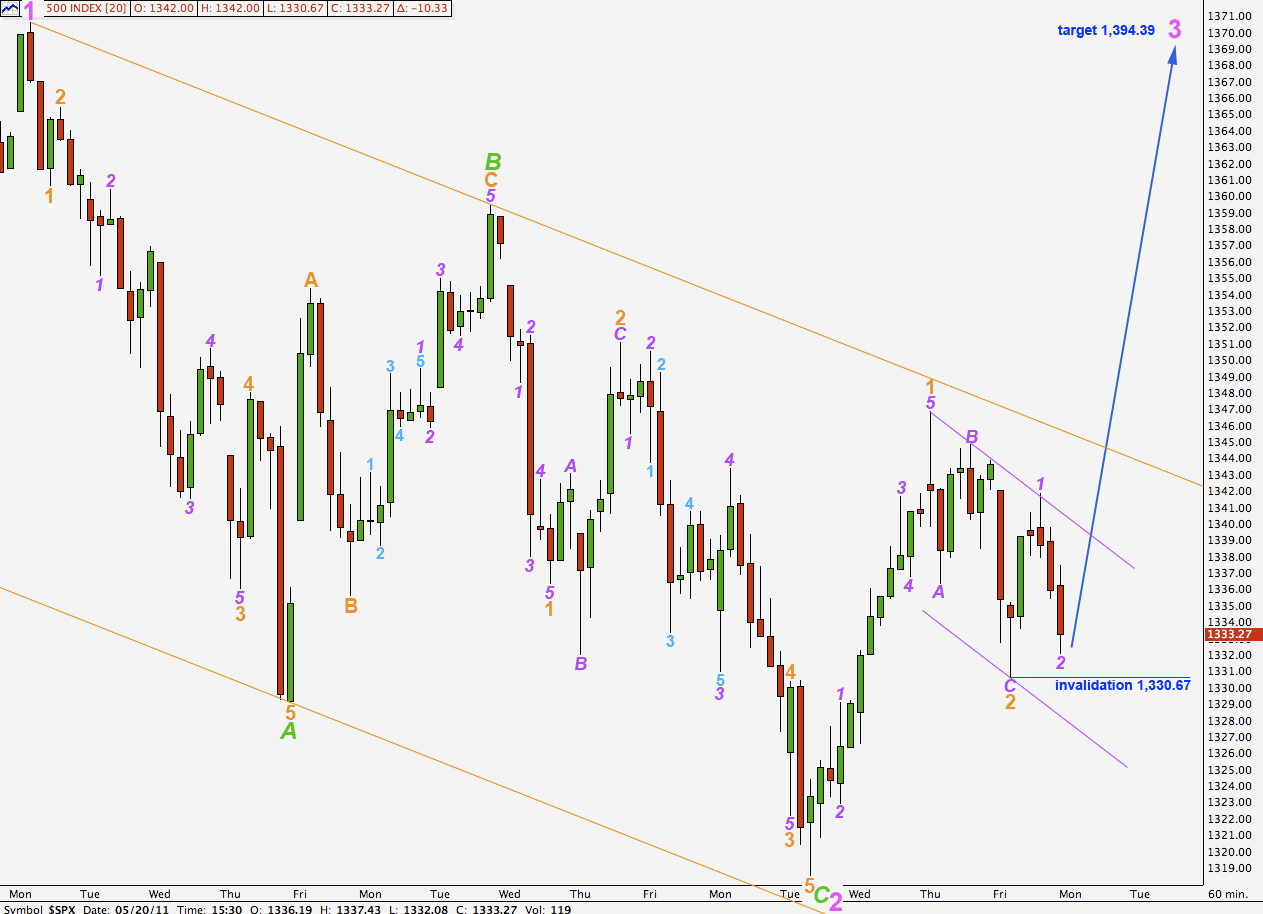
When we see this recent downwards zigzag as a minute (pink) degree wave then the size and duration makes more sense than our previous wave count which saw it as a sub-minute degree wave.
Price has found strong resistance close to the upper edge of the parallel channel containing wave 2 pink. We may expect the next wave upwards, a third wave, to have enough momentum to take price out of the channel.
Within wave 3 pink upwards wave 1 orange is a complete impulse and wave 2 orange is a complete zigzag. Within wave 2 orange there is no fibonacci ratio between waves A and C purple.
When markets open on Monday wave 2 purple is most likely to move a little lower to complete a zigzag.
Wave 2 purple may not move beyond the start of wave 1 purple. This wave count is invalidated with movement below 1,330.67.
Wave 3 purple should take price above and outside the wide orange parallel channel containing wave 3 pink.
At 1,394.39 wave 3 pink will reach equality with wave 1 pink.
When we have a full hourly candlestick above the parallel channel here on the hourly chart then we shall have confirmation of a trend change at pink degree. Until that time we must allow for the possibility of new lows.
Hourly Alternate Wave Count.
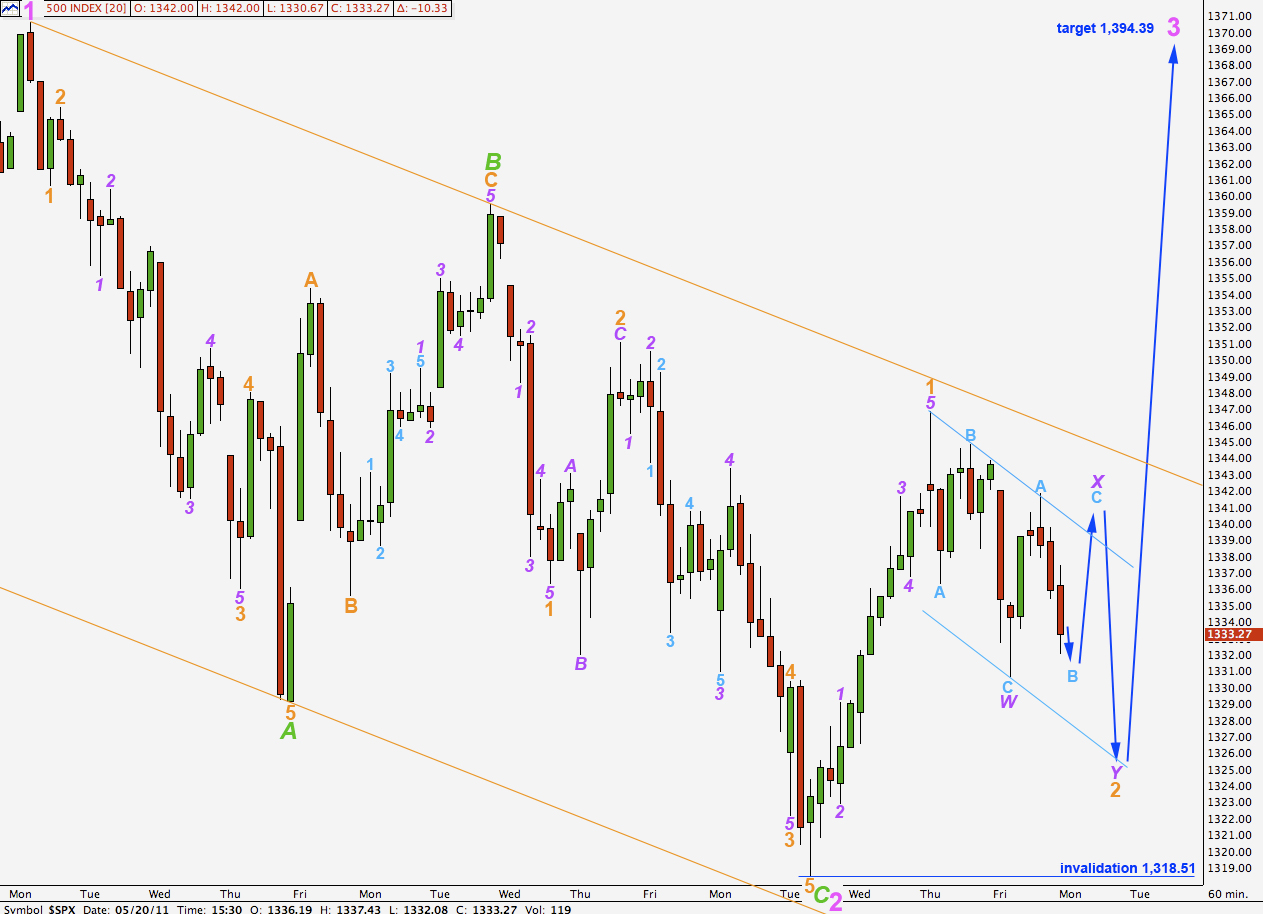
It is possible that the second wave correction which unfolded during Friday’s session is not yet over. It may extend further lower as a double zigzag, or sideways as a double combination.
The upwards wave labeled wave A aqua is a very clear five wave impulse on the 5 minute chart, and wave X purple cannot be over there. We would require a little downwards movement to complete a corrective structure for wave B aqua and then another five up to complete wave C aqua. Thereafter, we may see another corrective structure complete a double for wave 2 orange. This may take price lower.
Wave 2 orange may not move beyond the start of wave 1 orange. This wave count is invalidated with movement below 1,318.51.
Alternate Daily Wave Count.
There is another way to label the subdivisions within primary wave C within cycle wave B upwards.
Wave 3 black may not yet be over.
The subdivisions within wave 3 black have a better look with this wave count, but the trend channel drawn using Elliott’s technique does not fit at all. The trend channel I have drawn here is not Elliott’s technique, but it is an excellent fit.
The final fifth wave at blue degree to end wave 3 black for this wave count is an incomplete structure. This wave count requires further upwards movement.
The duration of a sub-minute (green) wave 2 showing up on the daily chart as big as it does also does not have the right look.
More importantly, wave 3 blue here is 16.18 points shorter than wave 1 blue. This limits wave 5 blue to no longer than equality with wave 3 blue, and as it is developing an extension this seems unlikely. The maximum limit for wave 5 blue to reach equality with wave 3 blue is at 1,420.09. There does not seem to be enough room for upwards movement to complete a satisfactory five wave structure for wave 5 blue.
Bad form to solicit comments and then refuse to publish them, as you did with the comment I left on your May 19 SPX analysis.
Even poorer form to use the points I made therein and claim them as your own.
reply to original comment reproduced below:
“The correct term for a fourth wave correction A-B-C-D-E is a triangle, there is no such thing as a descending wedge in Elliott wave terminology. At least it’s not mentioned in “Elliott Wave Principle”.
I do not present the obvious alternate count as you say because it has a minimum upwards requirement. My original intention was to switch at 1,485.16.
The channel I have drawn at the time of your comment had not been “violated”.
If comments contain inaccuracies and are abrupt I am inclined to simply delete them, rather than taking an inordinate amount of time to reply.”