
Elliott Wave chart analysis for the S&P 500 for 18th May, 2011. Please click on the charts below to enlarge.
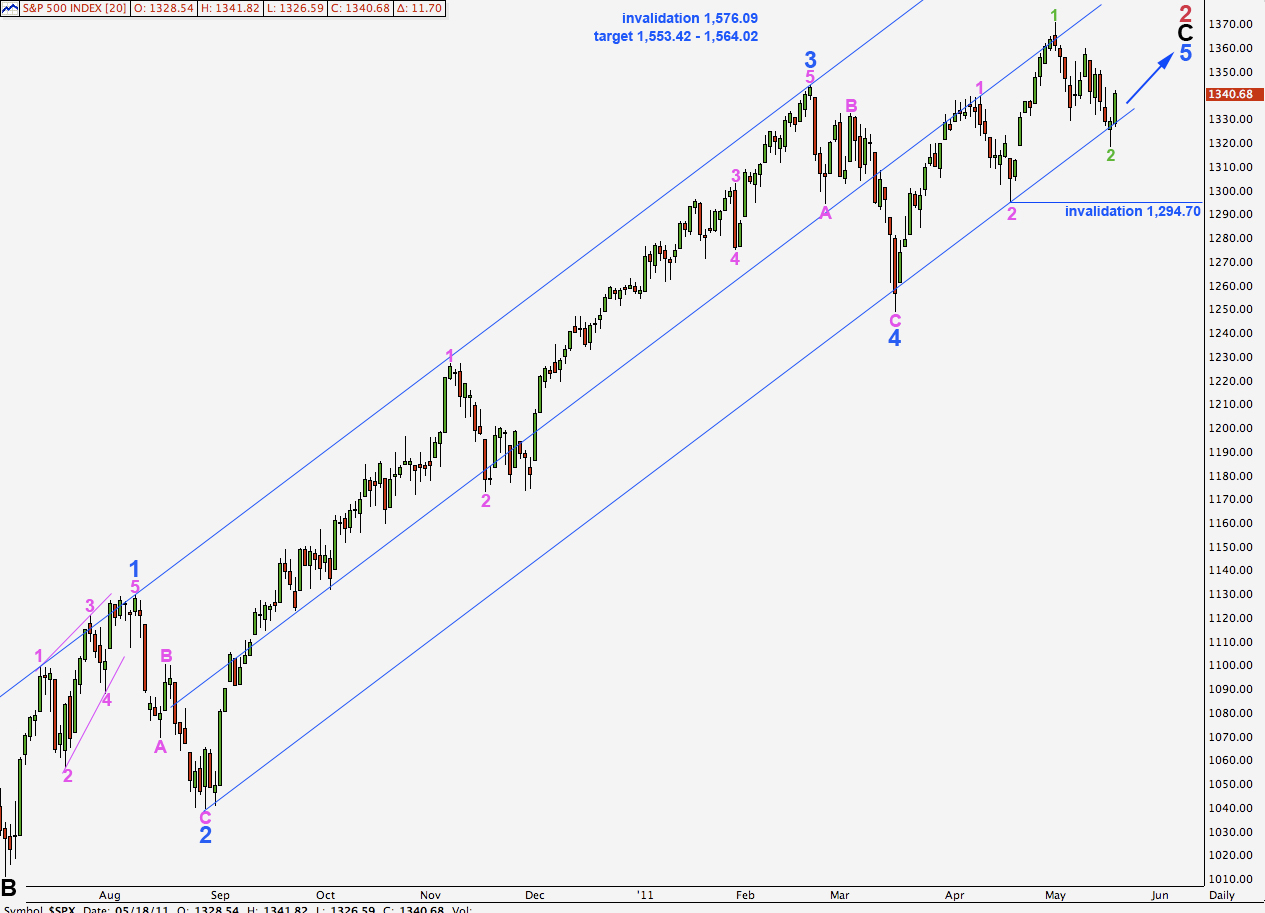
The S&P 500 has behaved exactly as expected during Wednesday’s session. We should expect this upwards trend to continue towards the targets here on the daily chart.
Because the last downwards wave moved into wave 1 pink price territory this may not be wave 4 pink. Wave 3 pink must be developing as an extended wave. We may expect momentum to increase as we move towards the middle of this third wave.
Corrections within this upwards wave may find strong support at the lower end of this trend channel on the daily chart.
It is possible that this third wave may break through the mid line and move into the upper half of the channel.
Targets remain the same. At 1,553.42 wave 5 blue will reach equality with wave 3 blue. At 1,564.02 wave C black will reach equality with wave A black. This is our long held target zone for upwards movement to end.
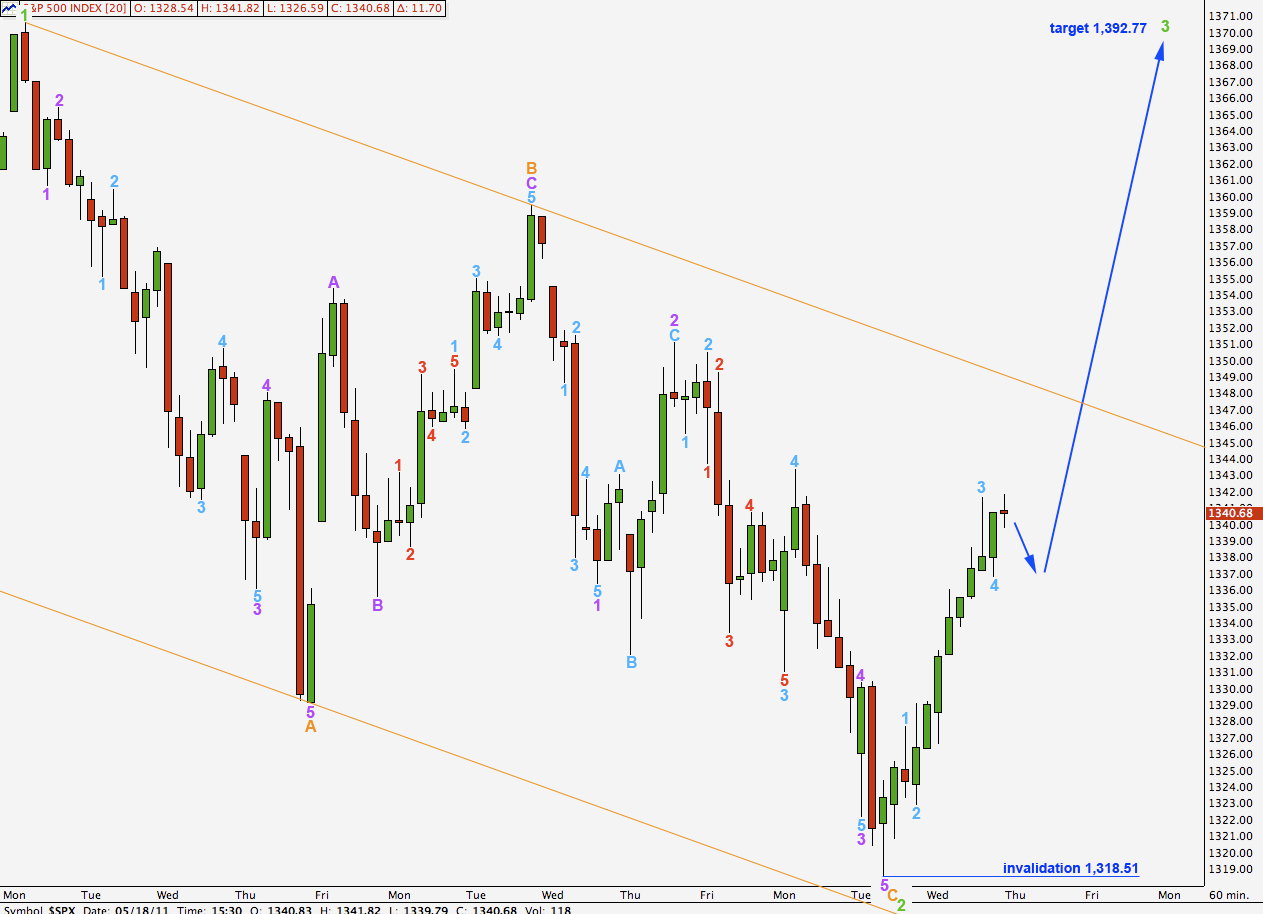
We have just the one hourly wave count today. As upwards movement develops further there will be alternate wave counts but at this early stage we should only need one.
Upwards movement is clearly impulsive compared to prior downwards movement which is more choppy and overlapping. Wave behaviour supports this wave count.
Movement above the orange trend channel would provide strong confirmation of this wave count.
Wave 3 aqua has no fibonacci ratio to wave 1 aqua. It is more likely then that wave 5 aqua will exhibit a ratio to either of 1 or 3 aqua. At 1,348.91 wave 5 aqua will reach equality with wave 1 aqua. About this point we may see a small second wave correction, before price continues higher.
At 1,392.77 wave 3 green will reach 1.618 the length of wave 1 green.
The upcoming second wave correction may not move beyond the start of wave 1. This wave count is invalidated with movement below 1,318.51.
Lara,
It looks like at 1392.77, wave 3 green would reach equality with wave 1 green. Am I counting the length of wave 1 green incorrectly (approximately 75 points)?
Thanks,
Peter